Energy Calendars
Each calendar shows a full year of a building's electricity use, one dot per hour, color-coded by outdoor temperature. This project originated from a study of Lake Flato energy monitor data from 2014 to 2020. They cover a variety of building types. New construction, 100-year-old buildings, offices, part-time homes, and net-zero pavilions.
By viewing the energy data in this format, occupancy patterns stand out in a way that wouldn't be noticeable otherwise; work weeks, holidays and thermostat schedules appear as visible patterns.
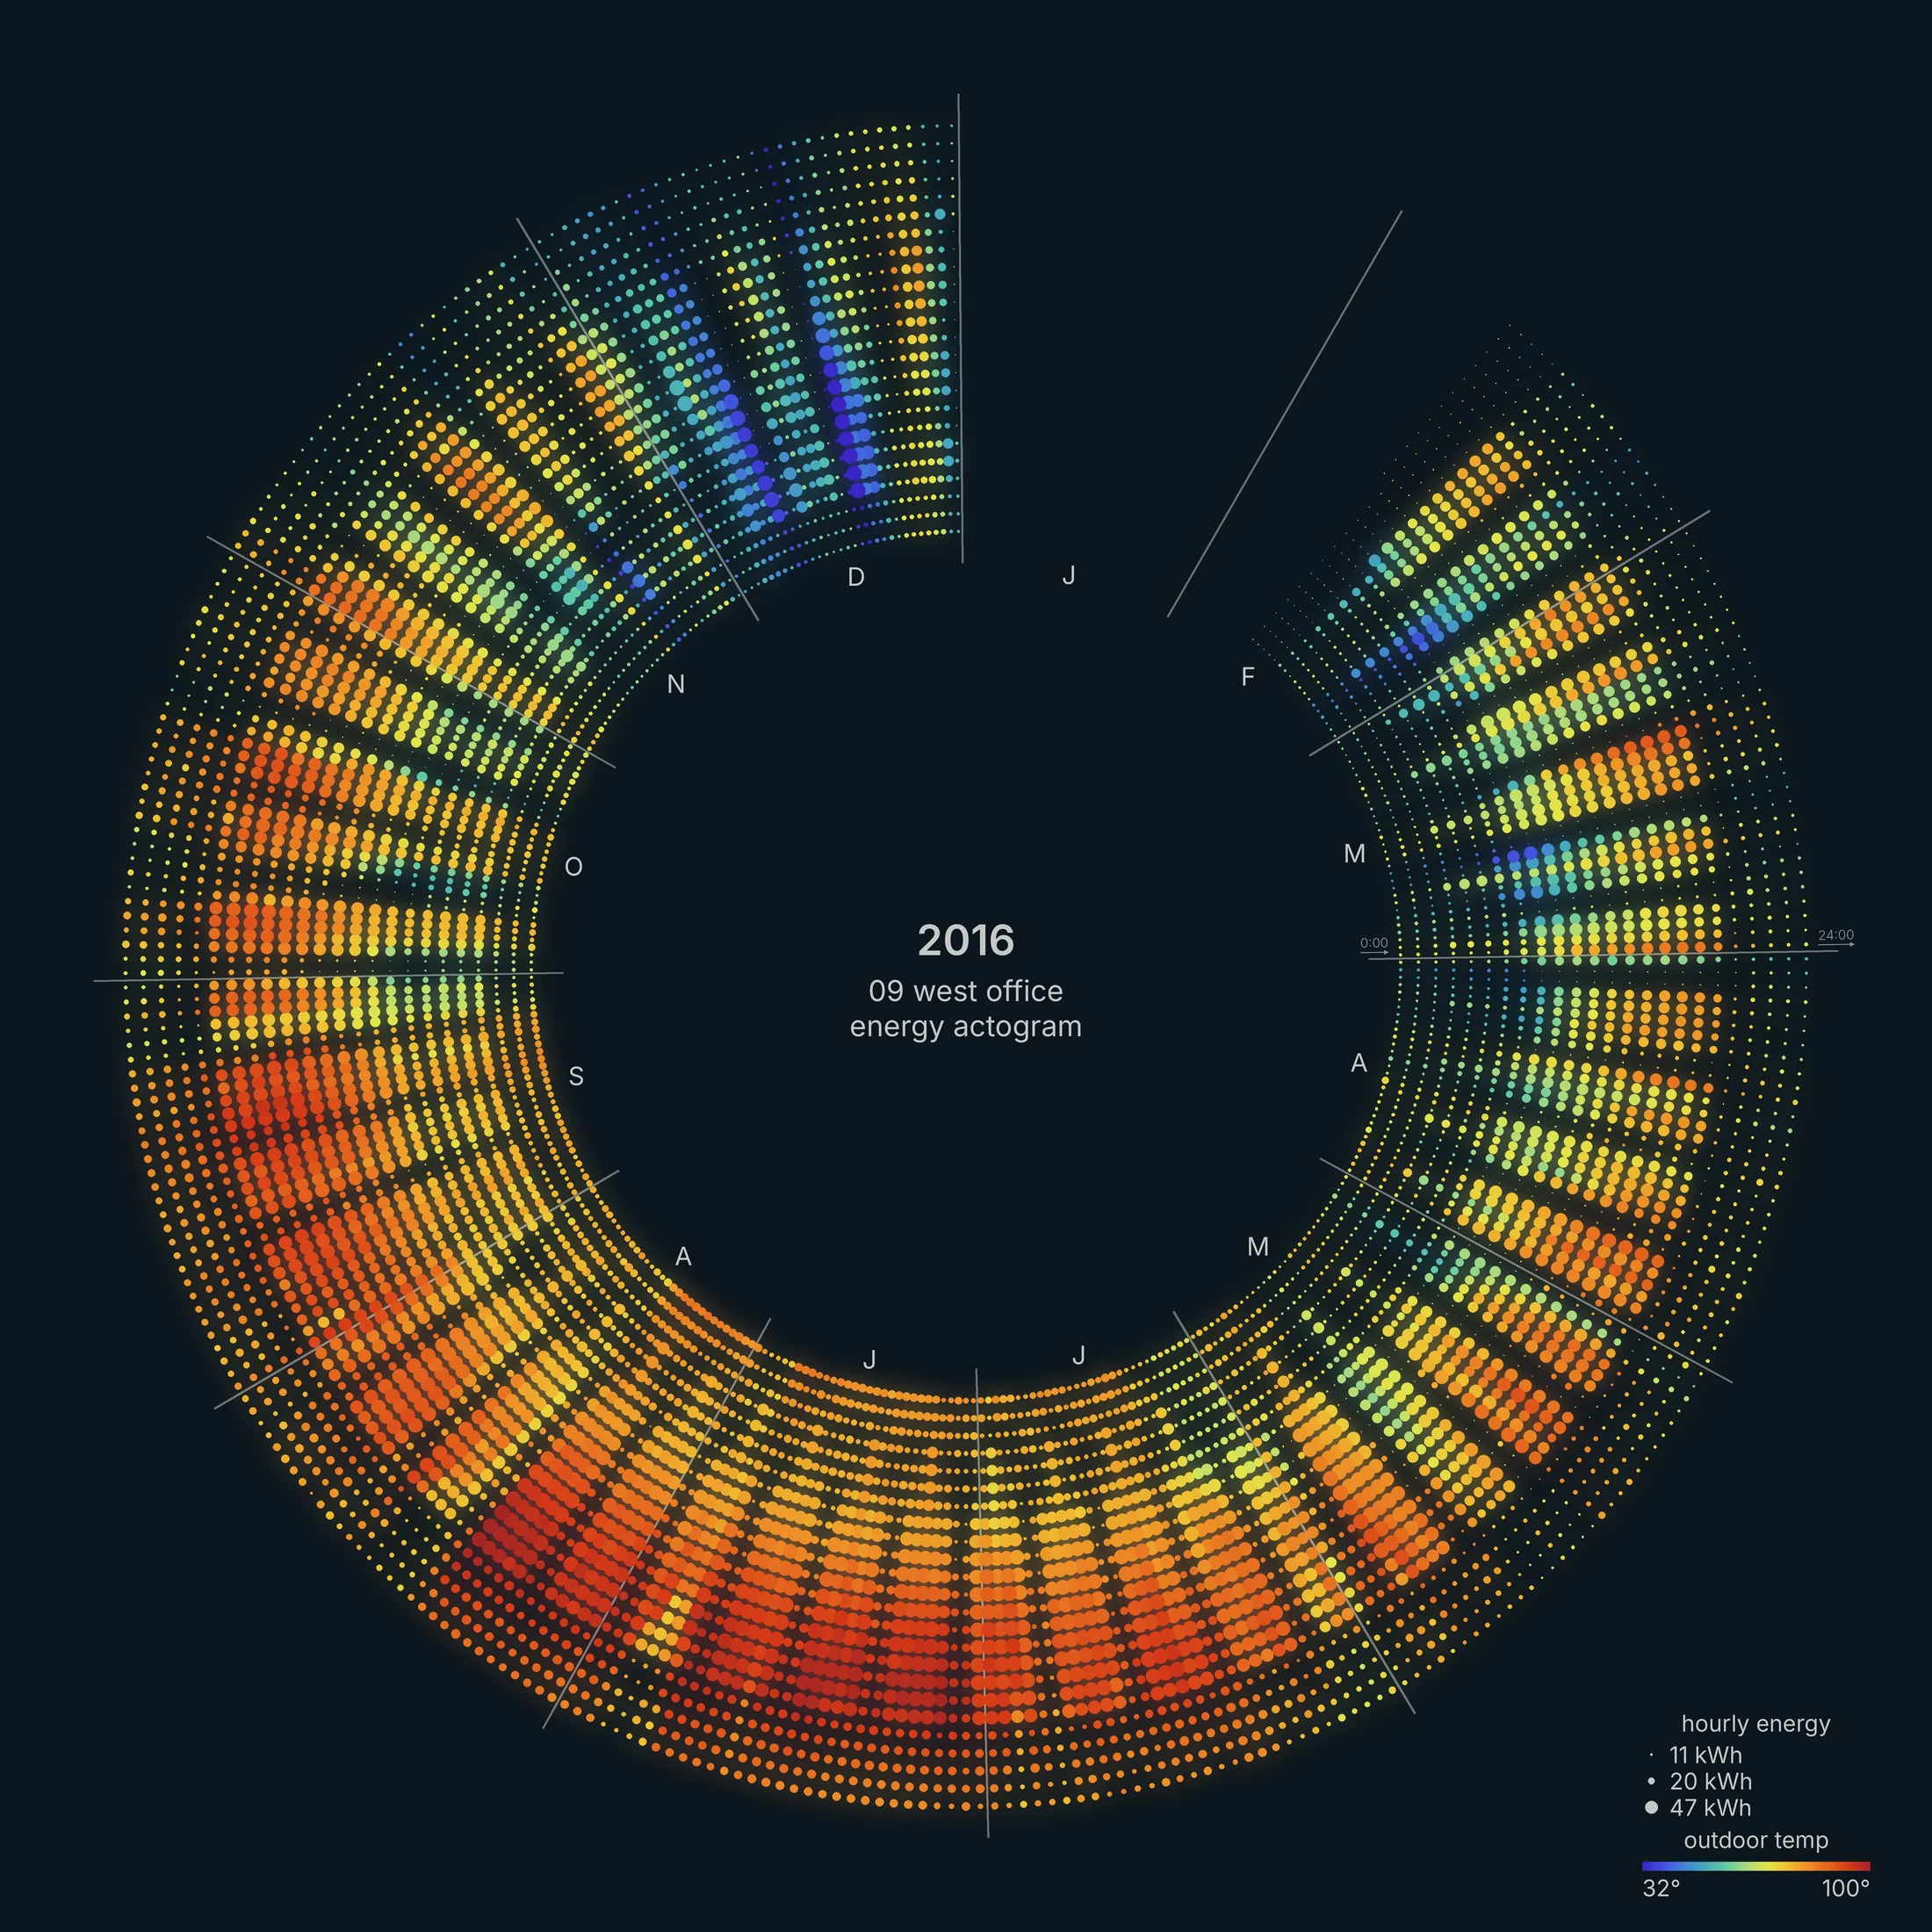
How to read them. Each calendar is one year, running clockwise with January 1 at the top. Each dot is one hour, and each spoke is one day, running inside to outside, midnight to midnight.
Dot sizes show energy use. The area of each dot is proportional to the energy used that hour, scaled between that building's 5th and 99th percentile hour. Color shows outdoor temperature, from 32°F in blue to 100°F in red.
Full-Time Residences
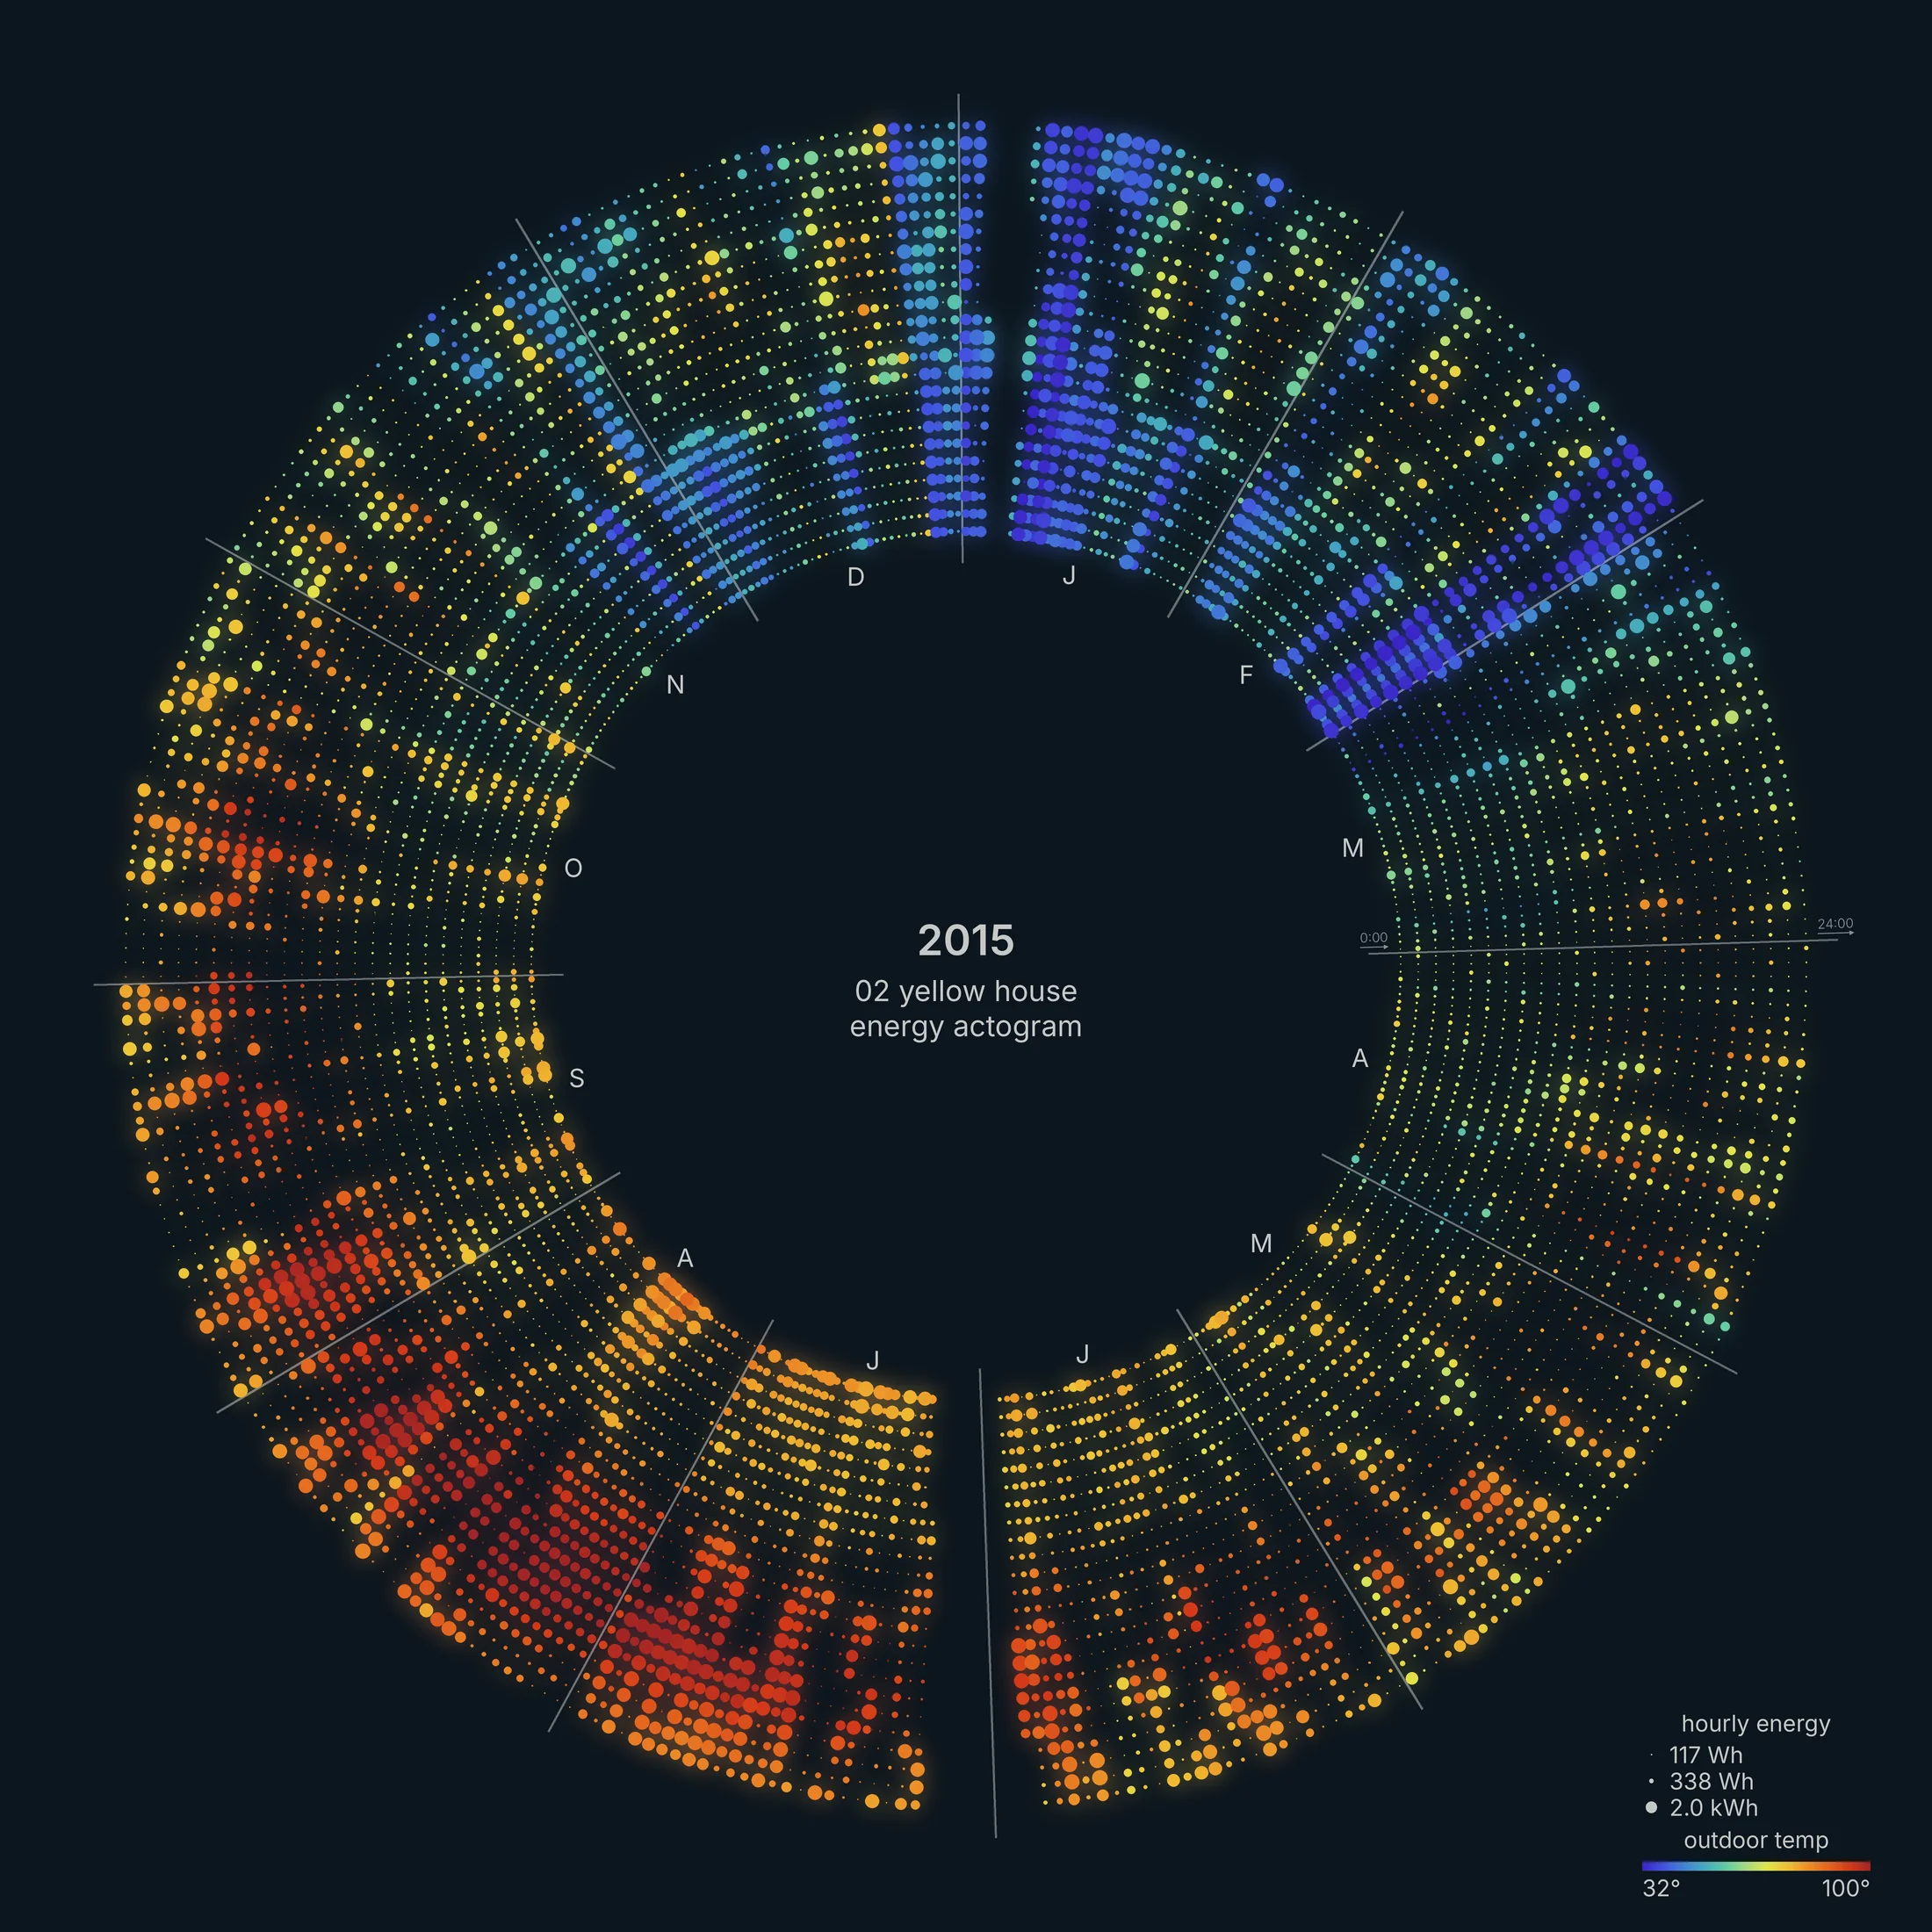
A small house in central Texas (900 square feet), with an older, leakier envelope. Air conditioning shows up as large orange and red dots in the outer rings through the summer. The thermostat is set back on weekdays while the occupants are at work mid-day. Heating peaks in January, the coldest month.
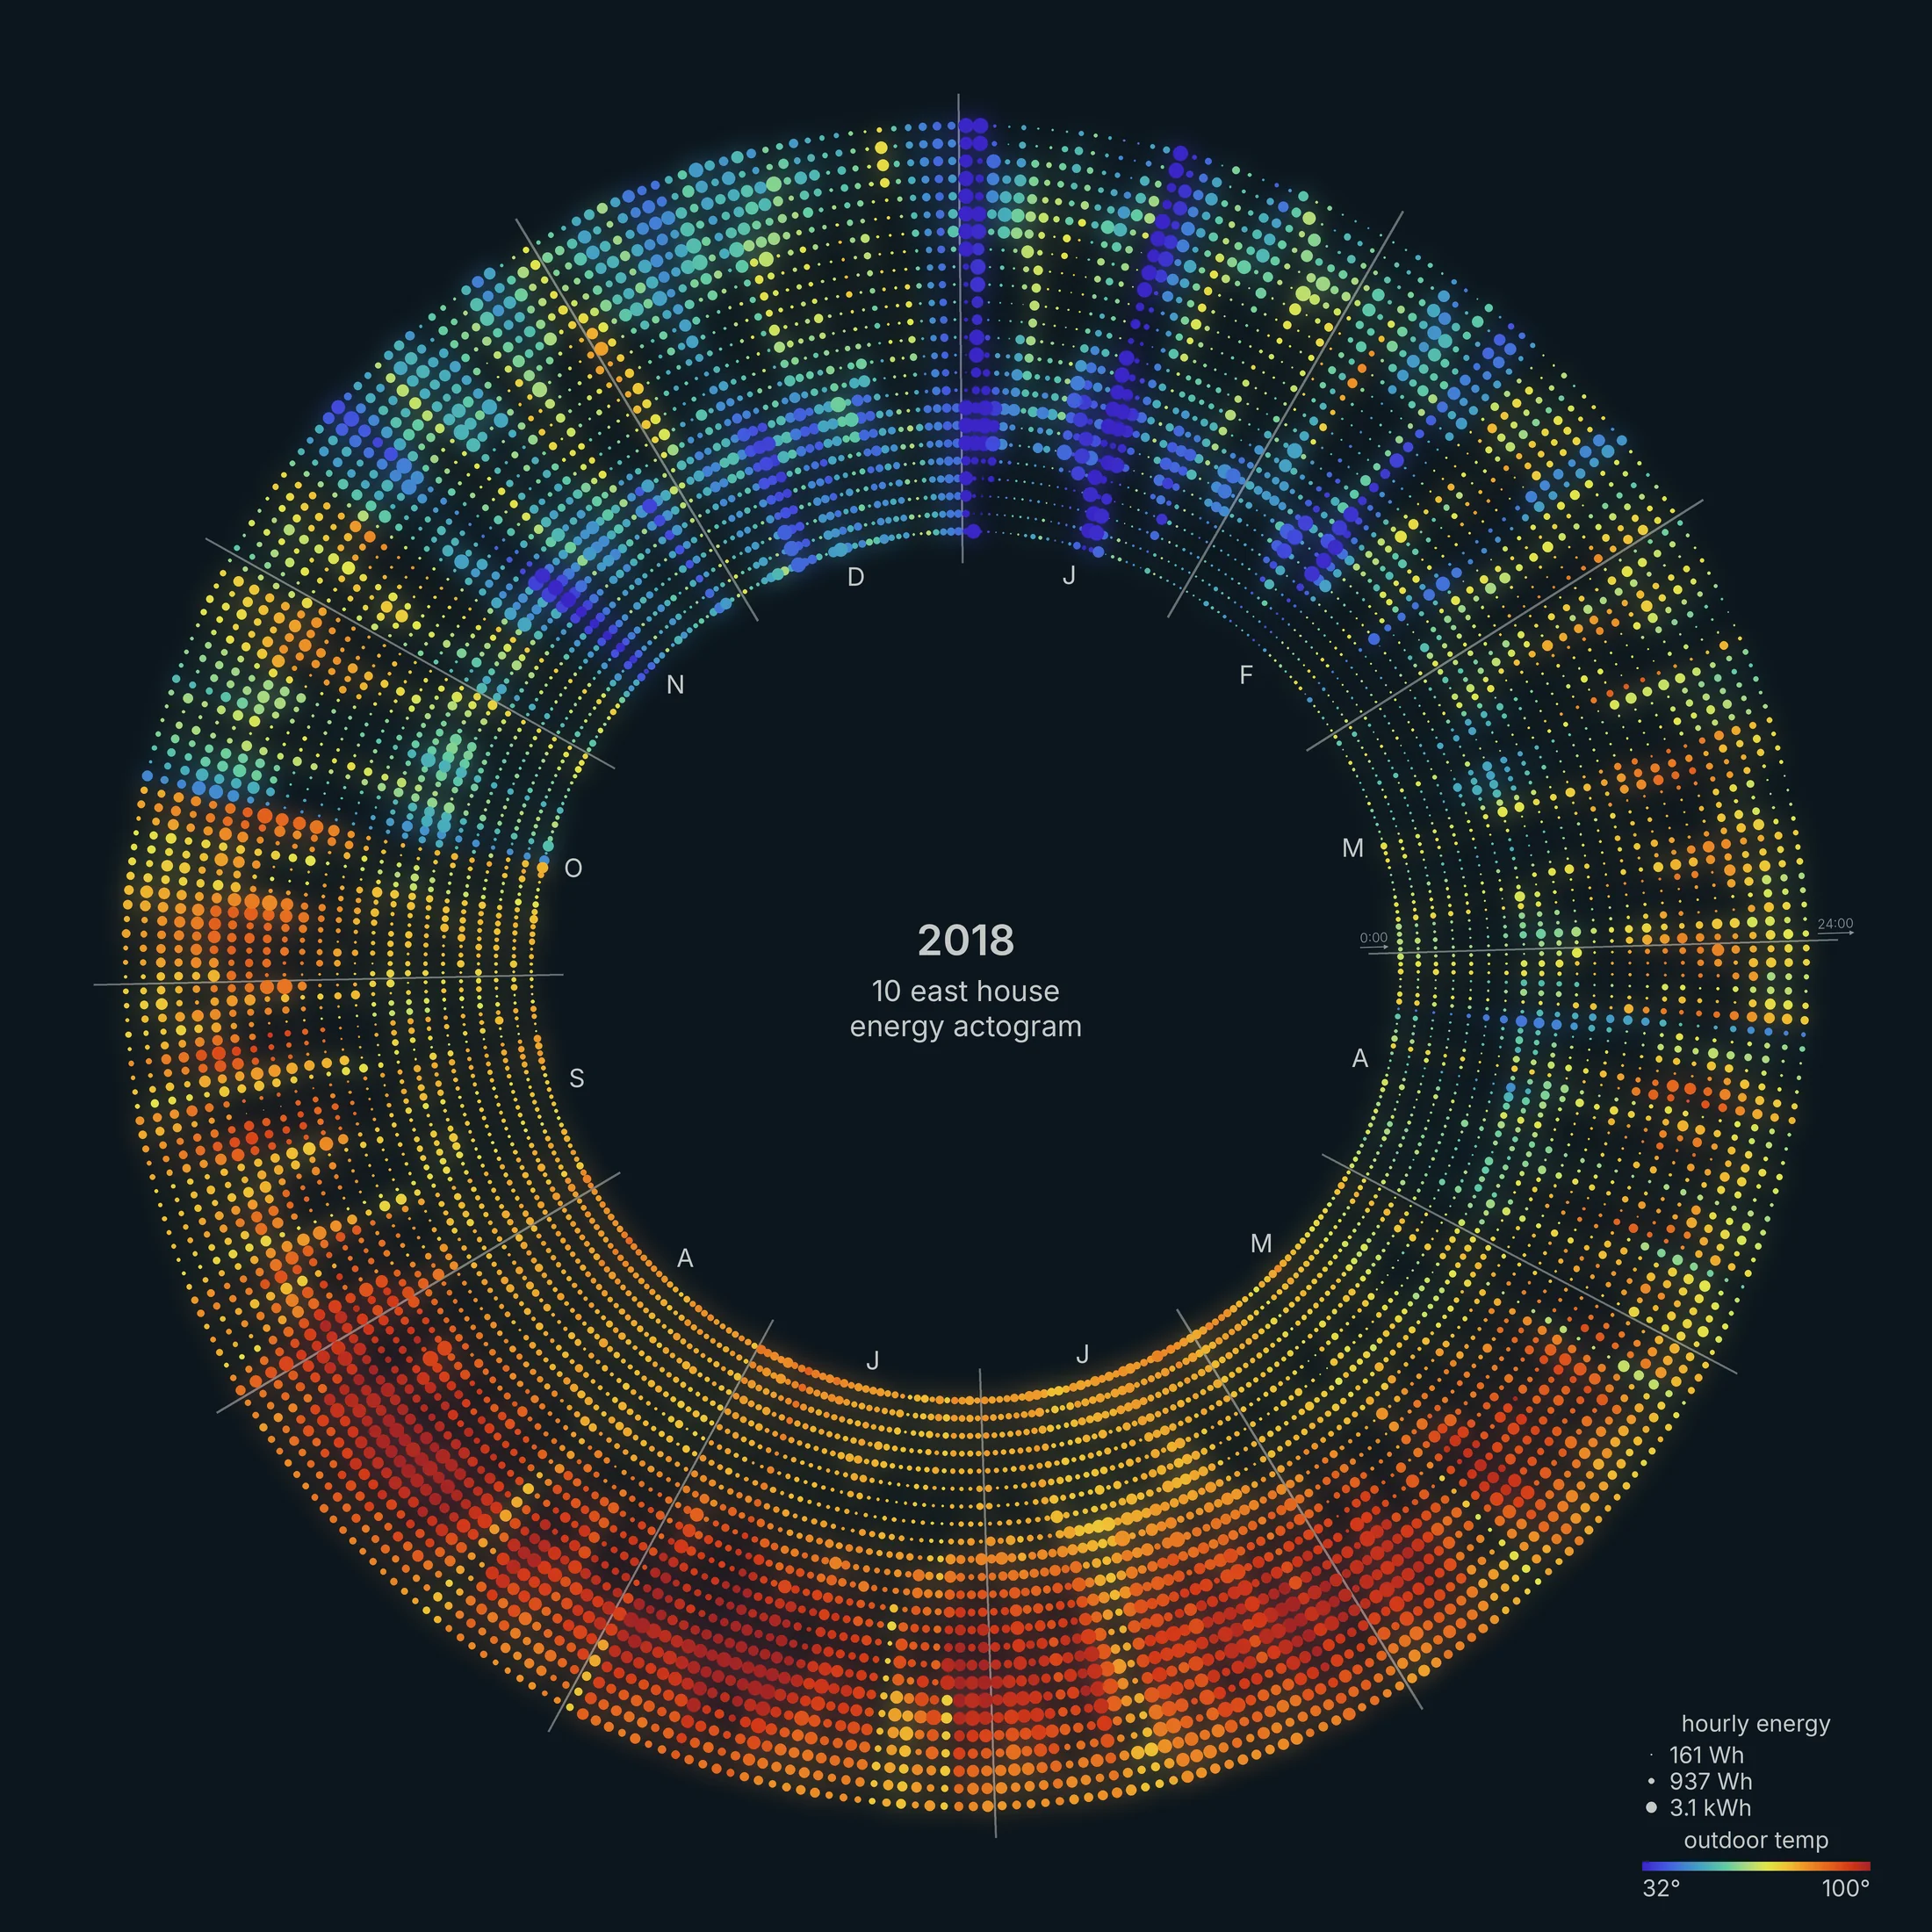
Another central Texas house (1,800 square feet), with a similar pattern. The calendar shows total use before rooftop solar.. The blue spokes at the top show the same January 2018 cold snap. On the coldest days of January, (about 28 to 30°F), the house used 121 and 137 kWh. That's about four times its median day of 31 kWh, which suggests electric resistance heat.
Always-On Homes
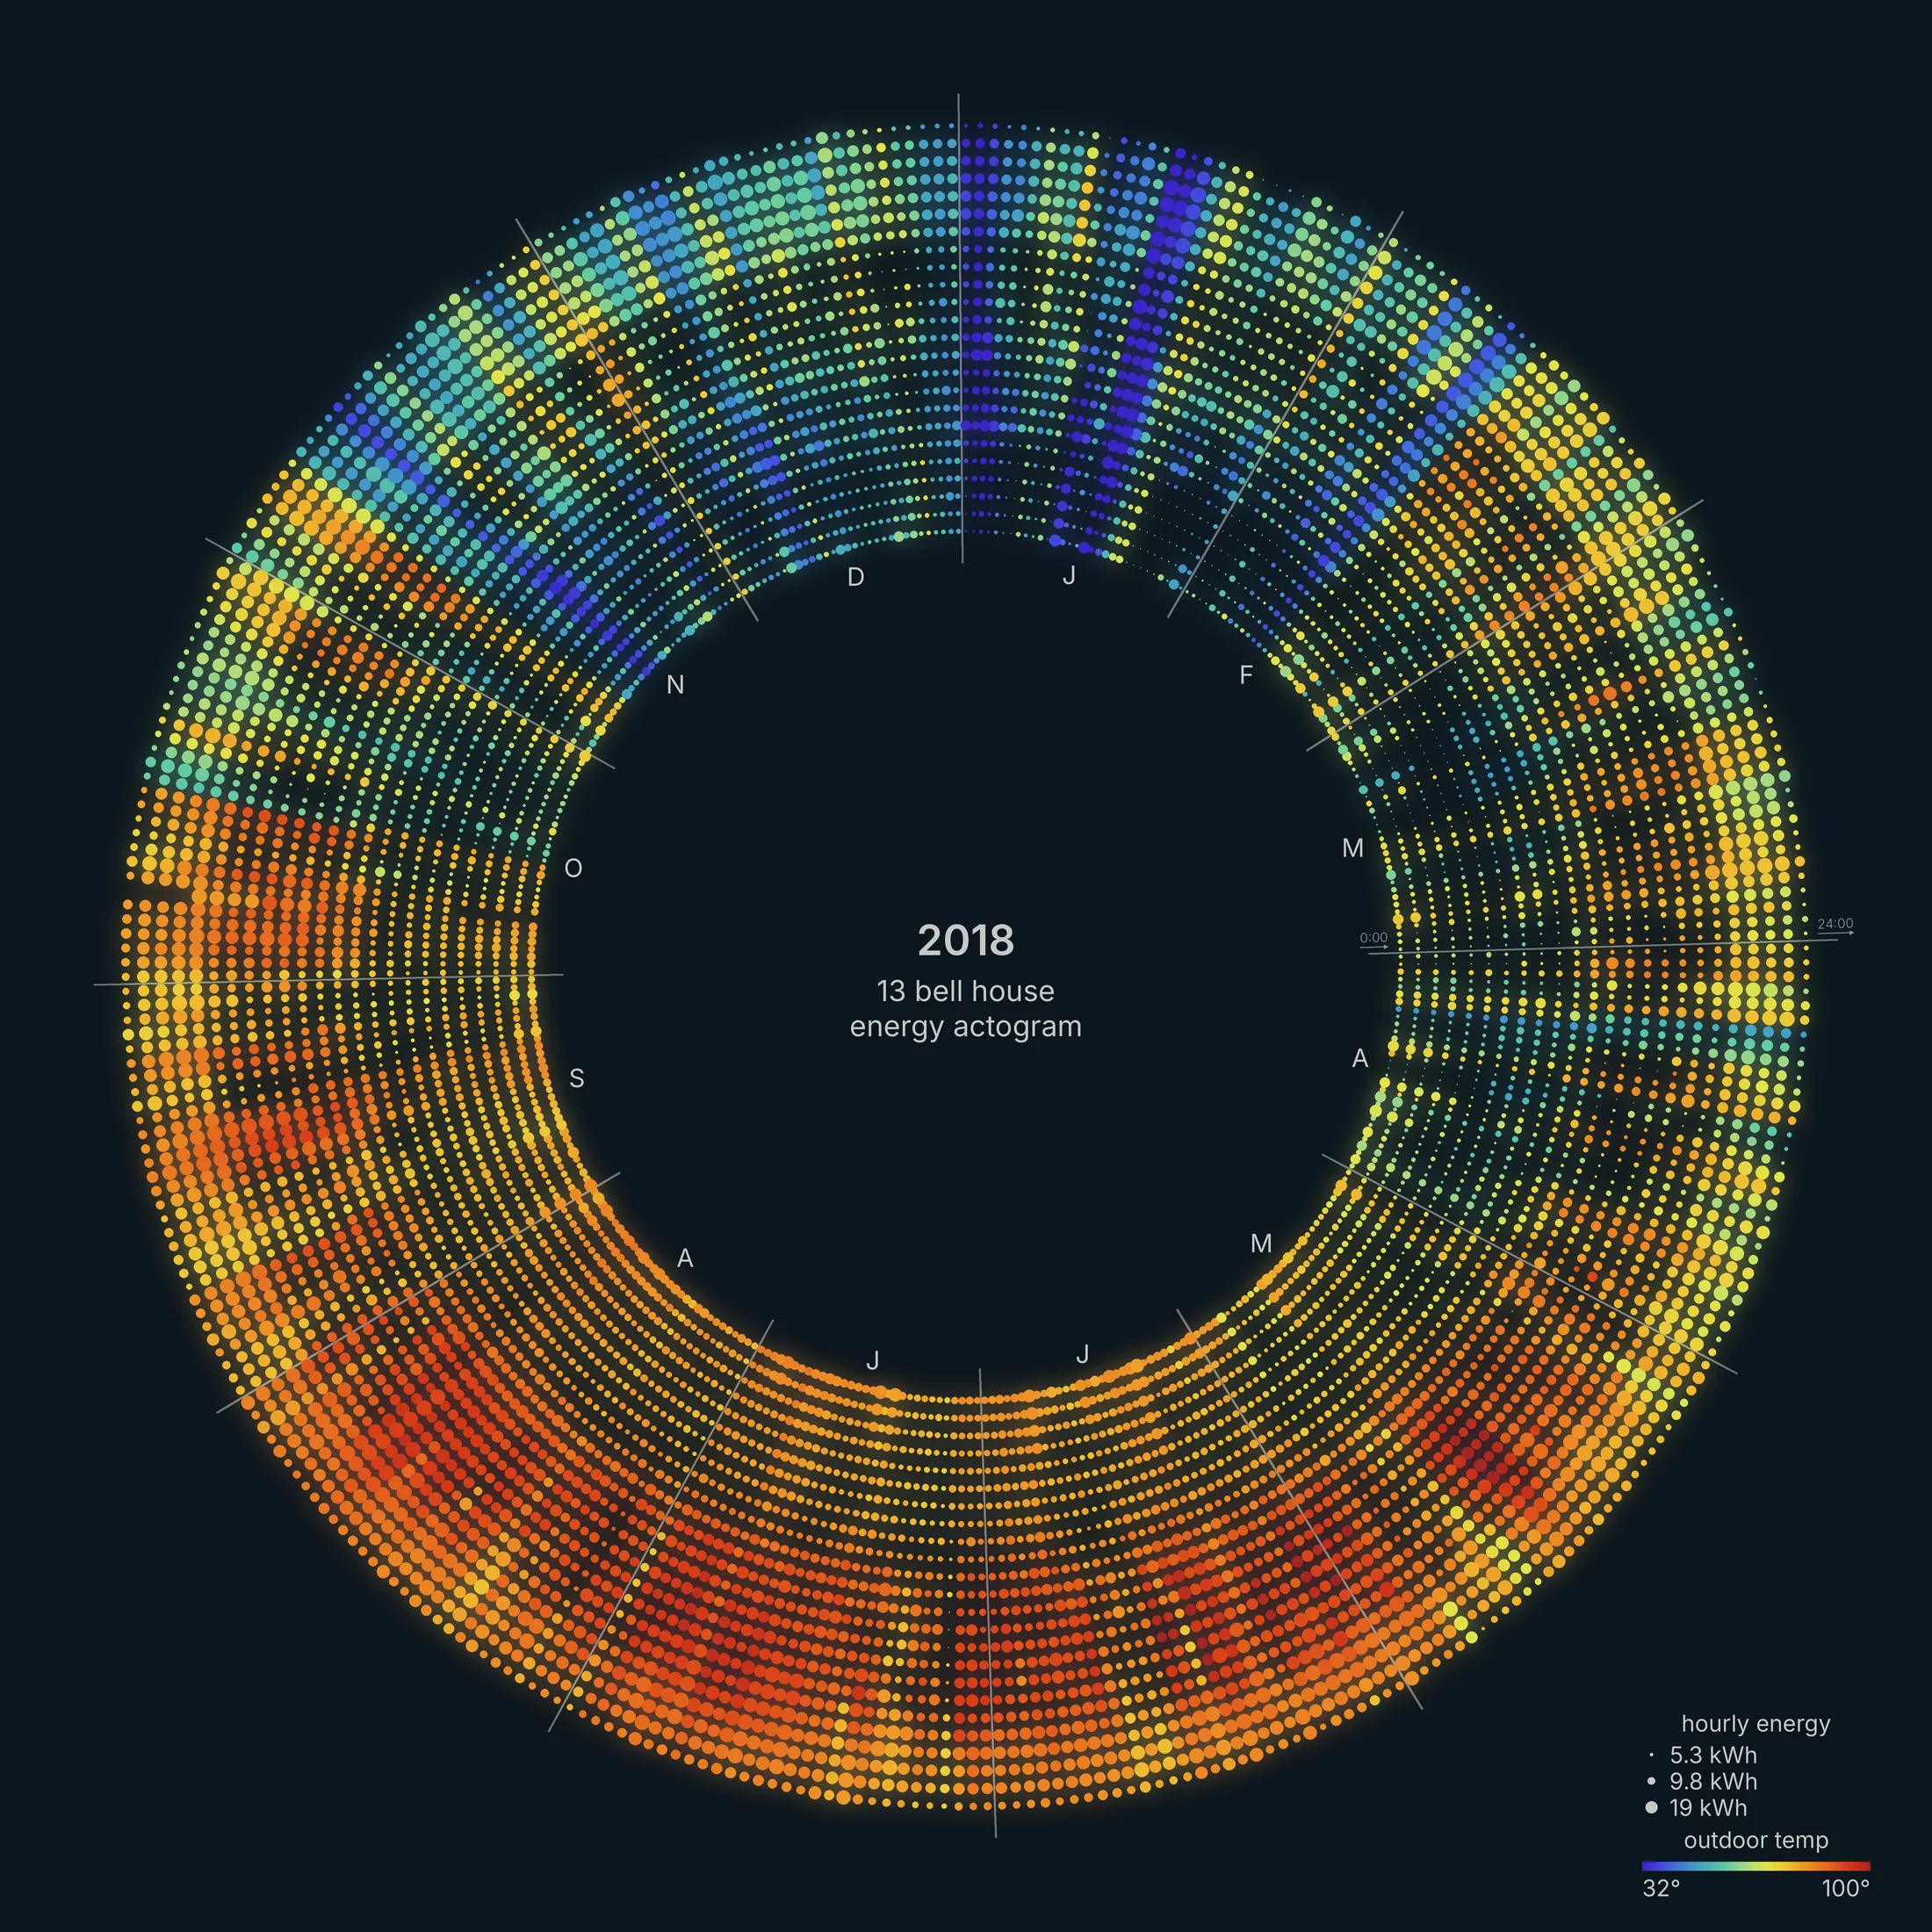
This is a larger house in south Texas (6,500 square feet). It rarely drops below 4 kW at any hour of the day or night. That floor alone is more than the average load of the smaller houses above.
About 1 kW in a garage circuit is likely car charging and geothermal heat pumps. The uniform ring tells us that this home is driven mostly by base-load, not weather.
Part-Time Residences
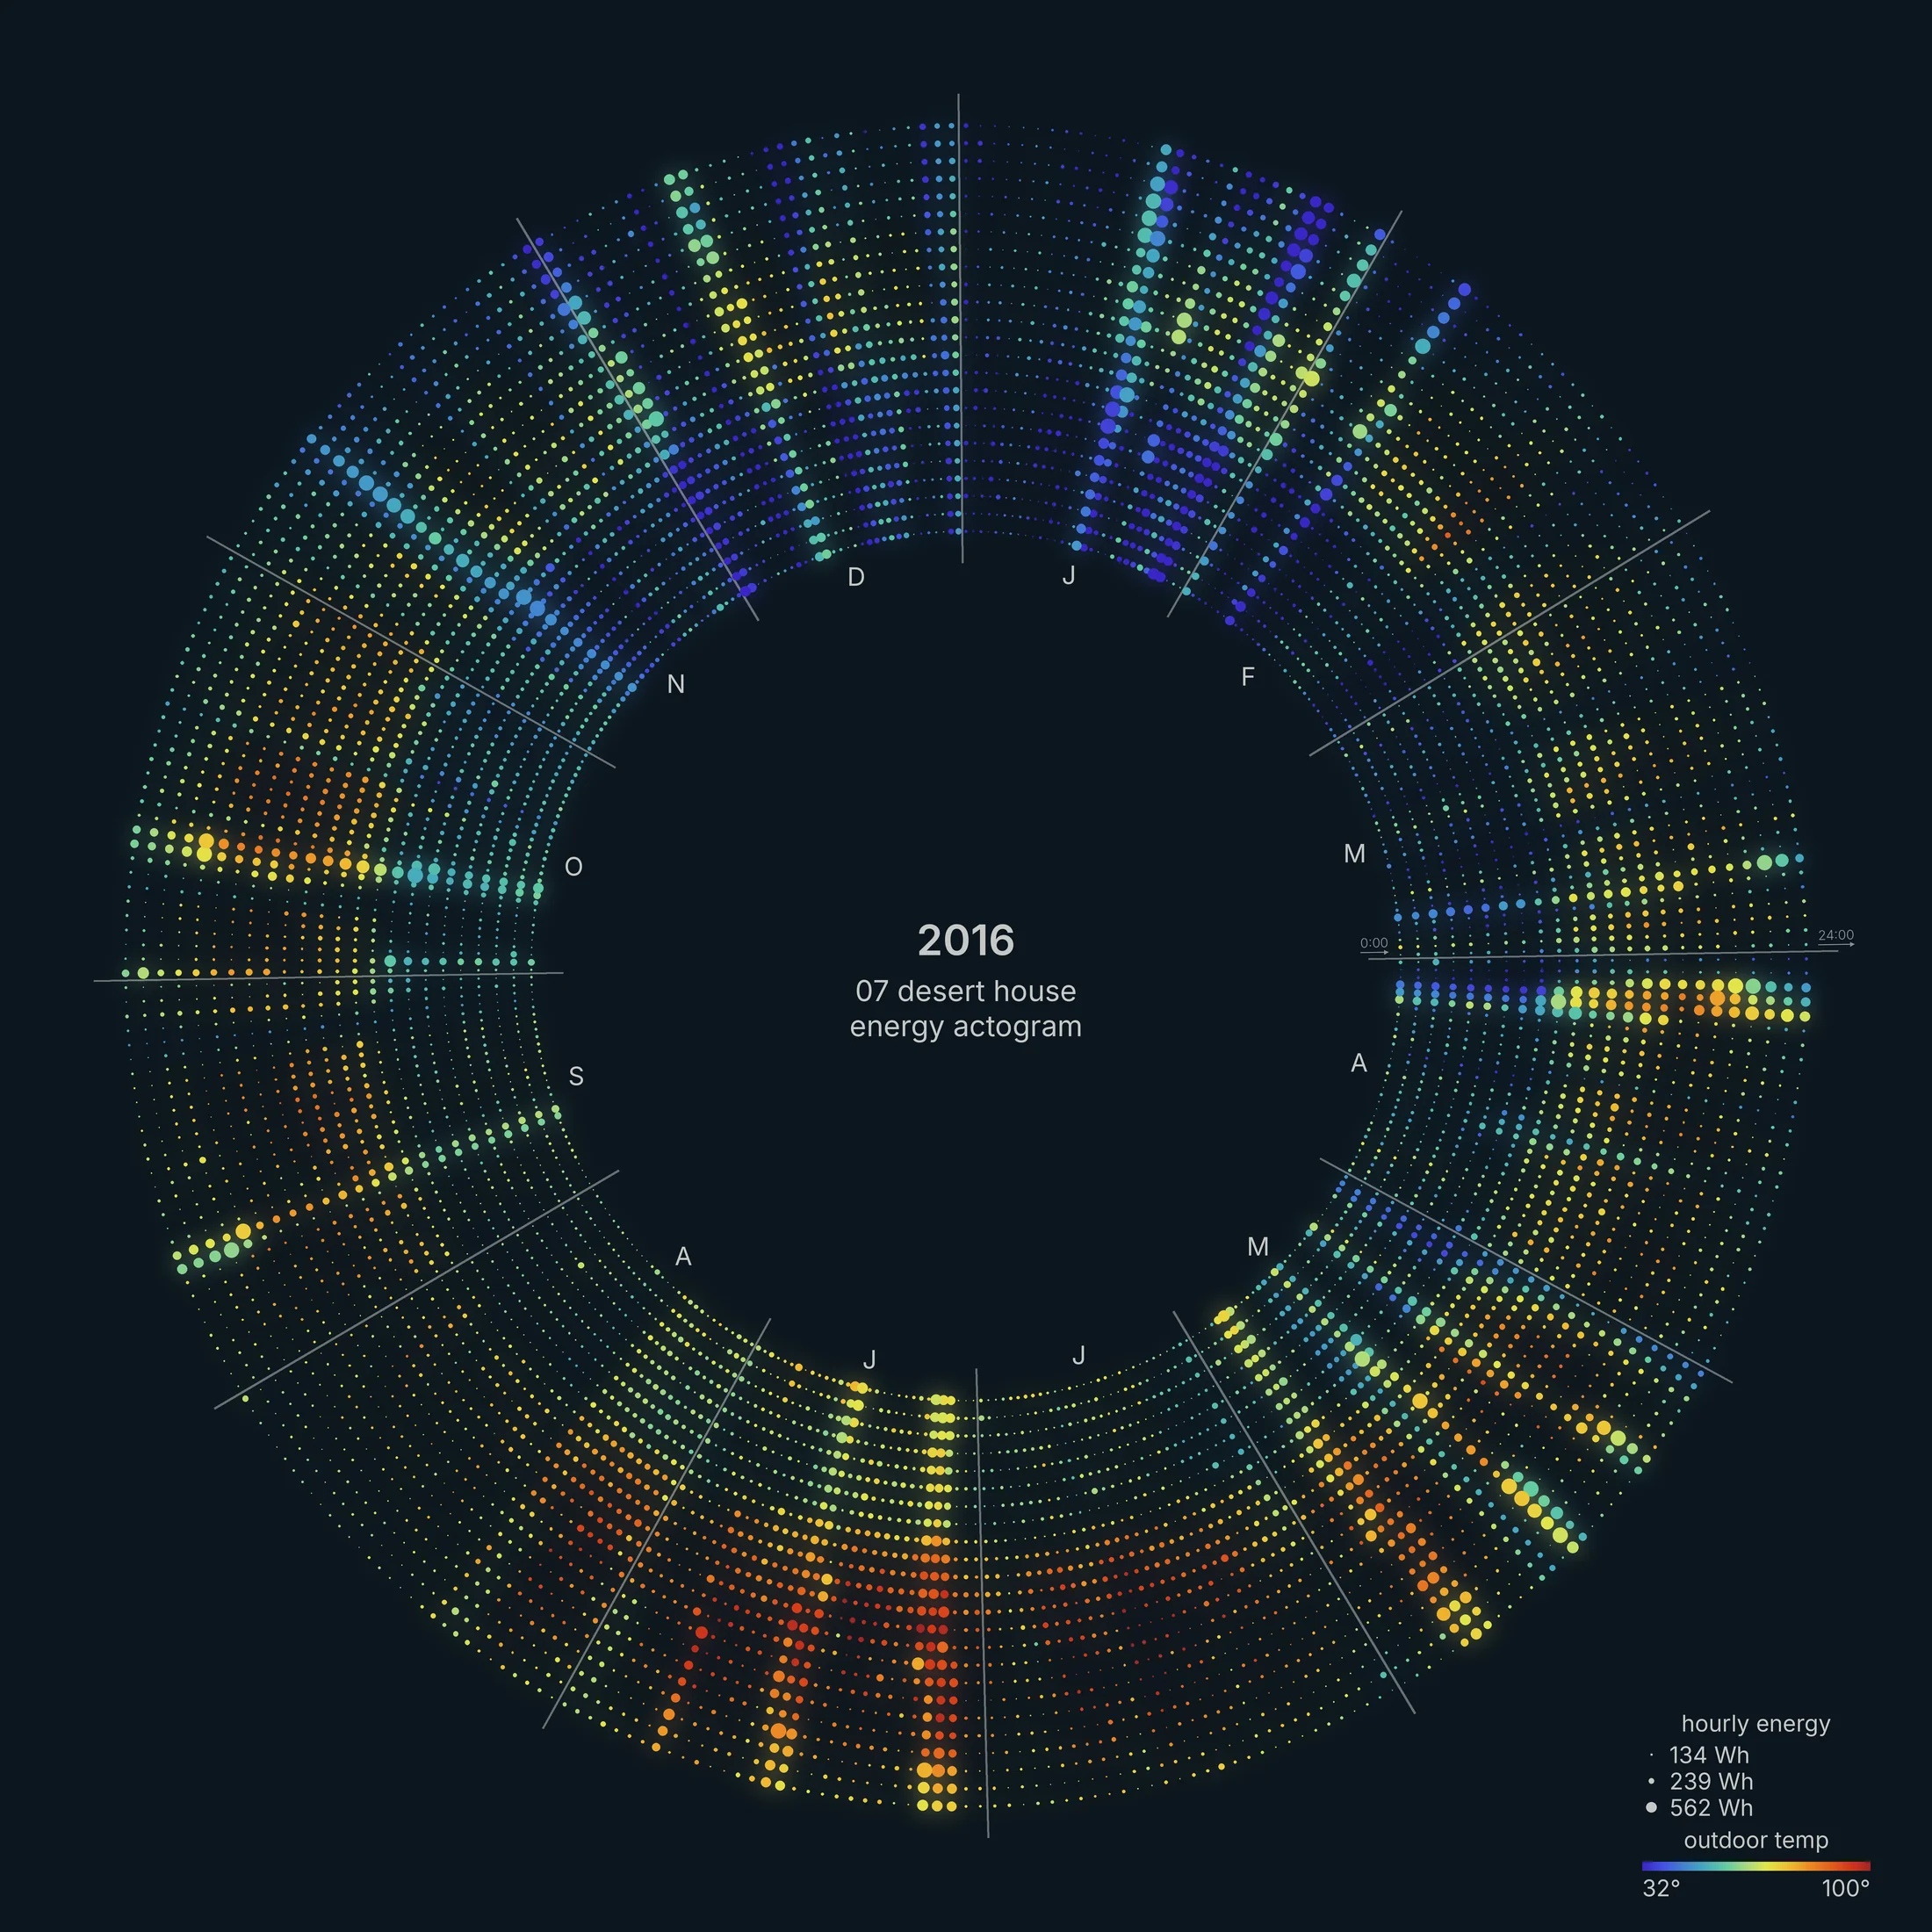
In this house in west Texas (1,200 square feet), it's clear that the house is occupied for a few days at a time. Temperatures are noticeably cooler than central Texas, about 9°F cooler on a typical day. When the house is empty it uses about 4 kWh a day, roughly 160 W of phantom loads.
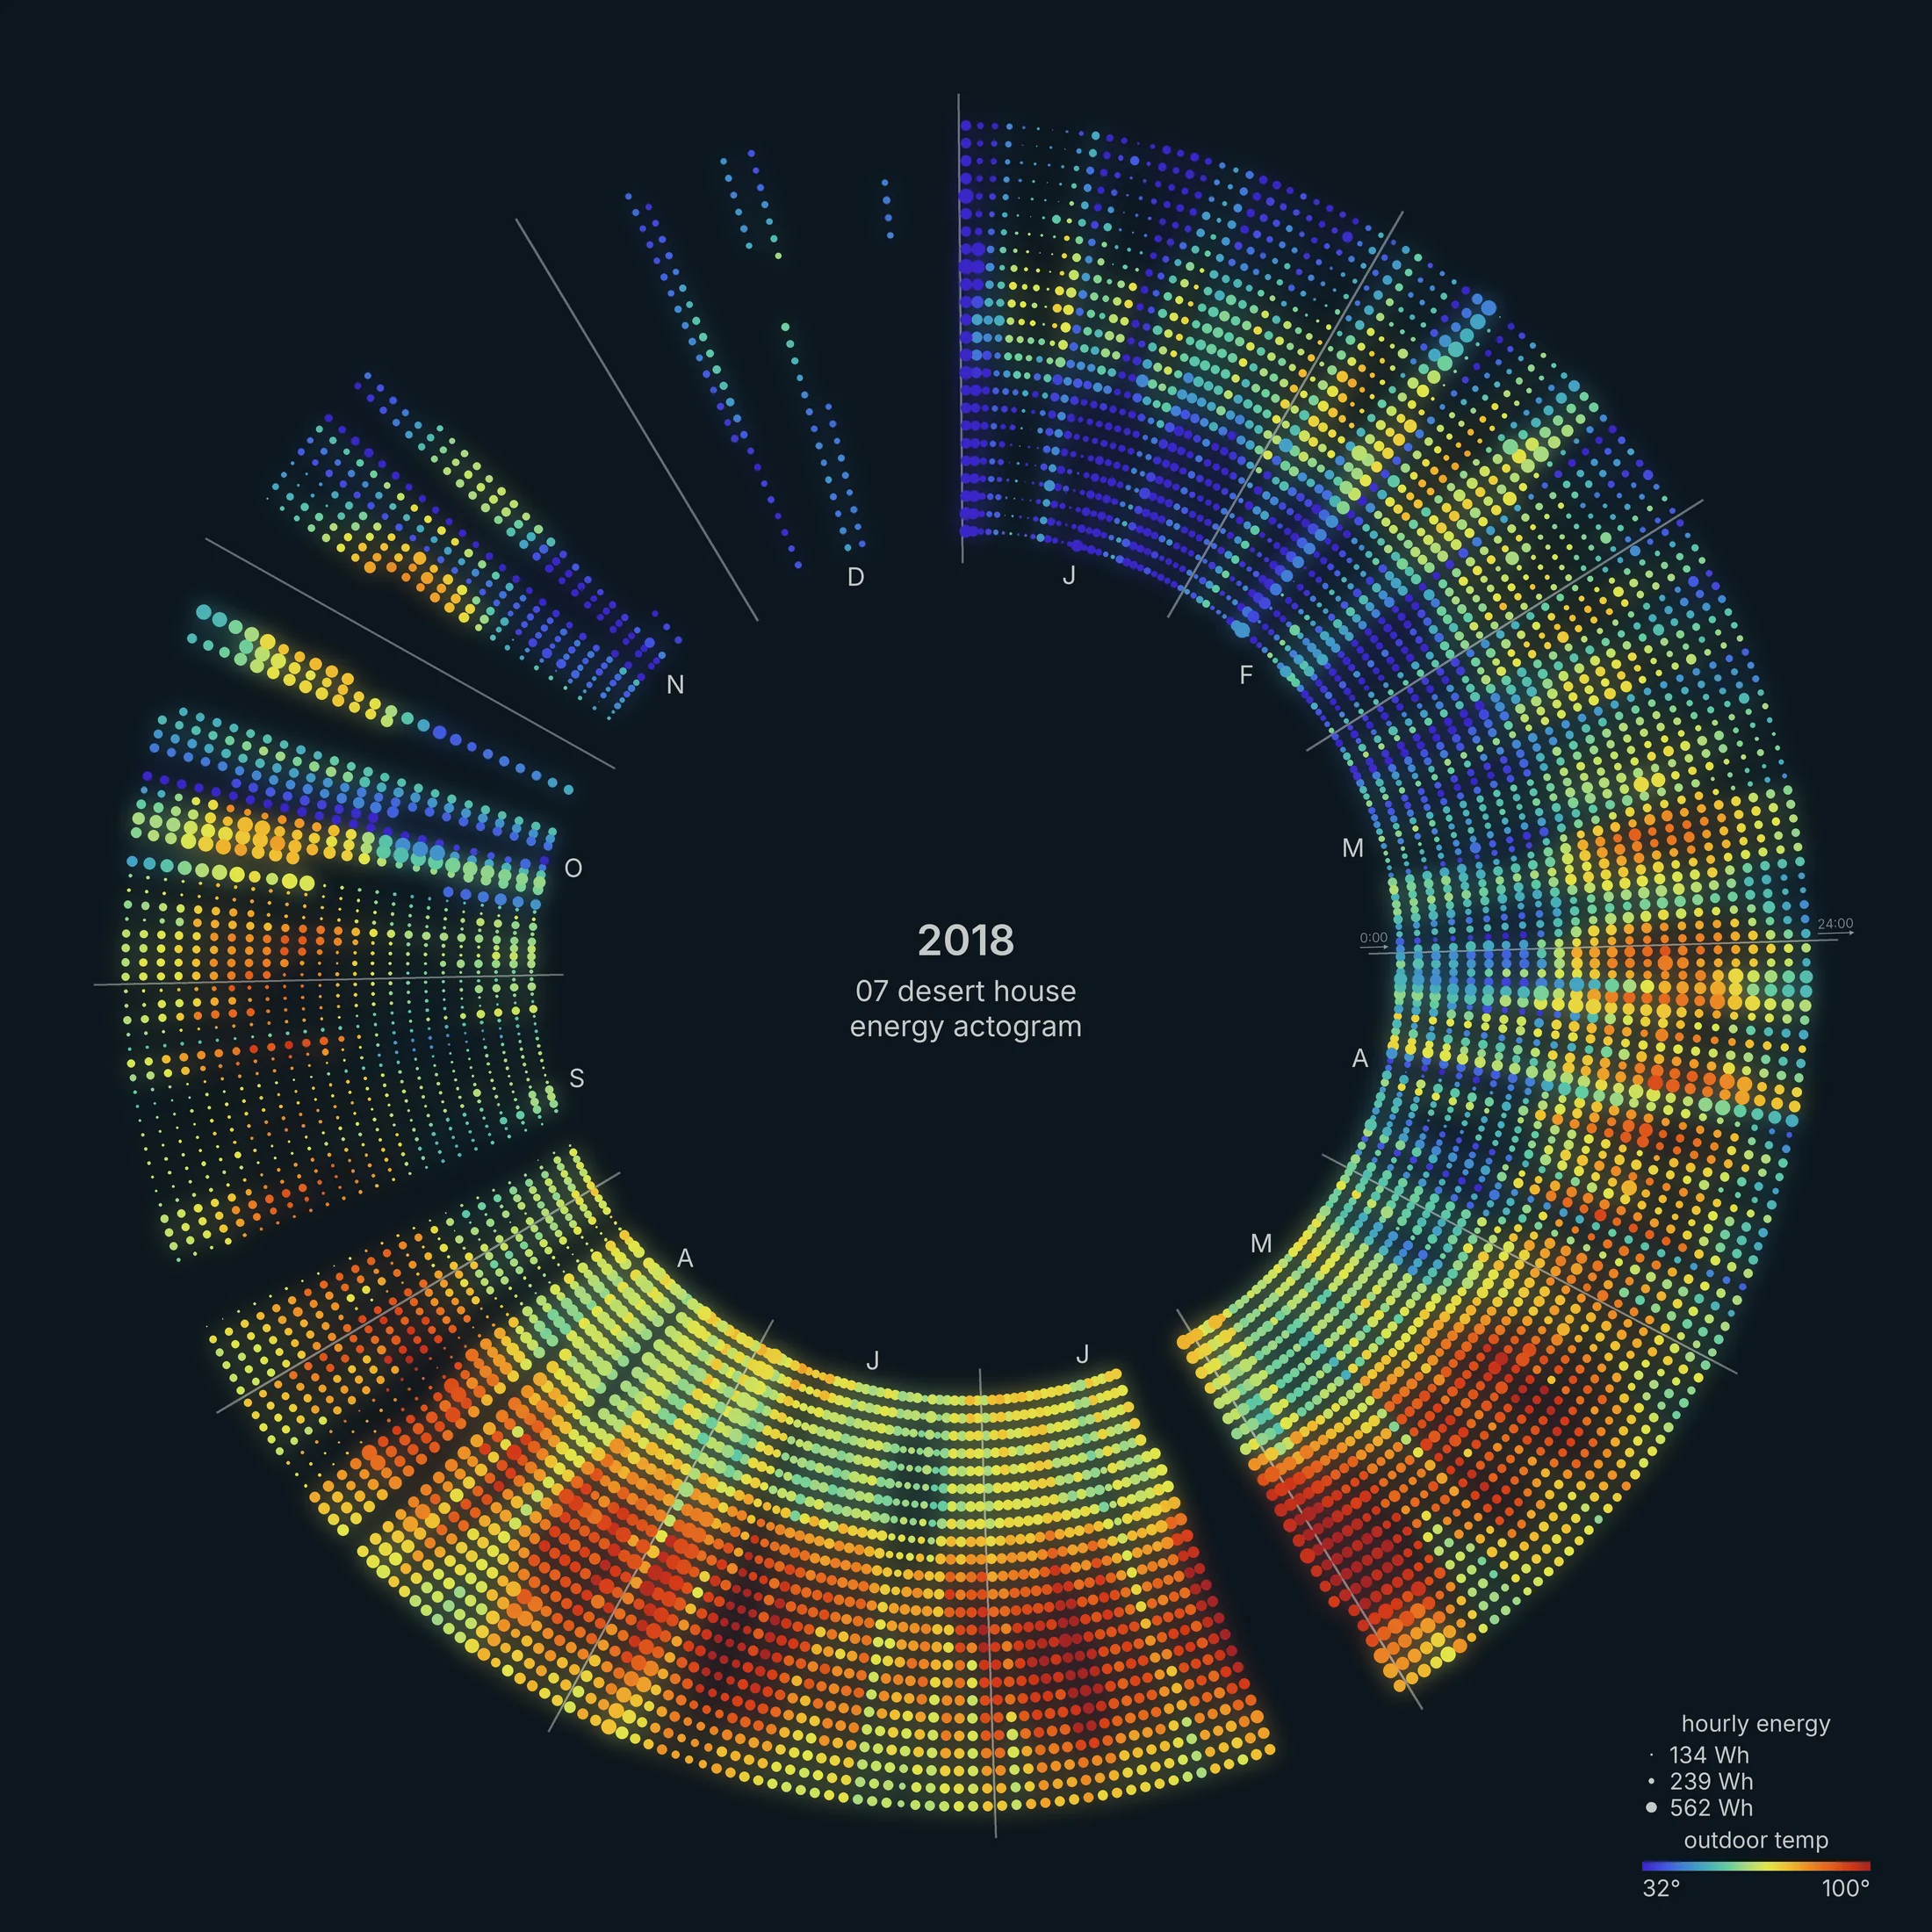
Two years later the same house looks different. The median day went from about 4 kWh in 2016 to about 10 kWh in 2018. Something changed in late 2017, either new equipment or a new routine, and the calendar shows it as a fuller ring with bigger dots. The thin spokes in November and December are monitor outages.
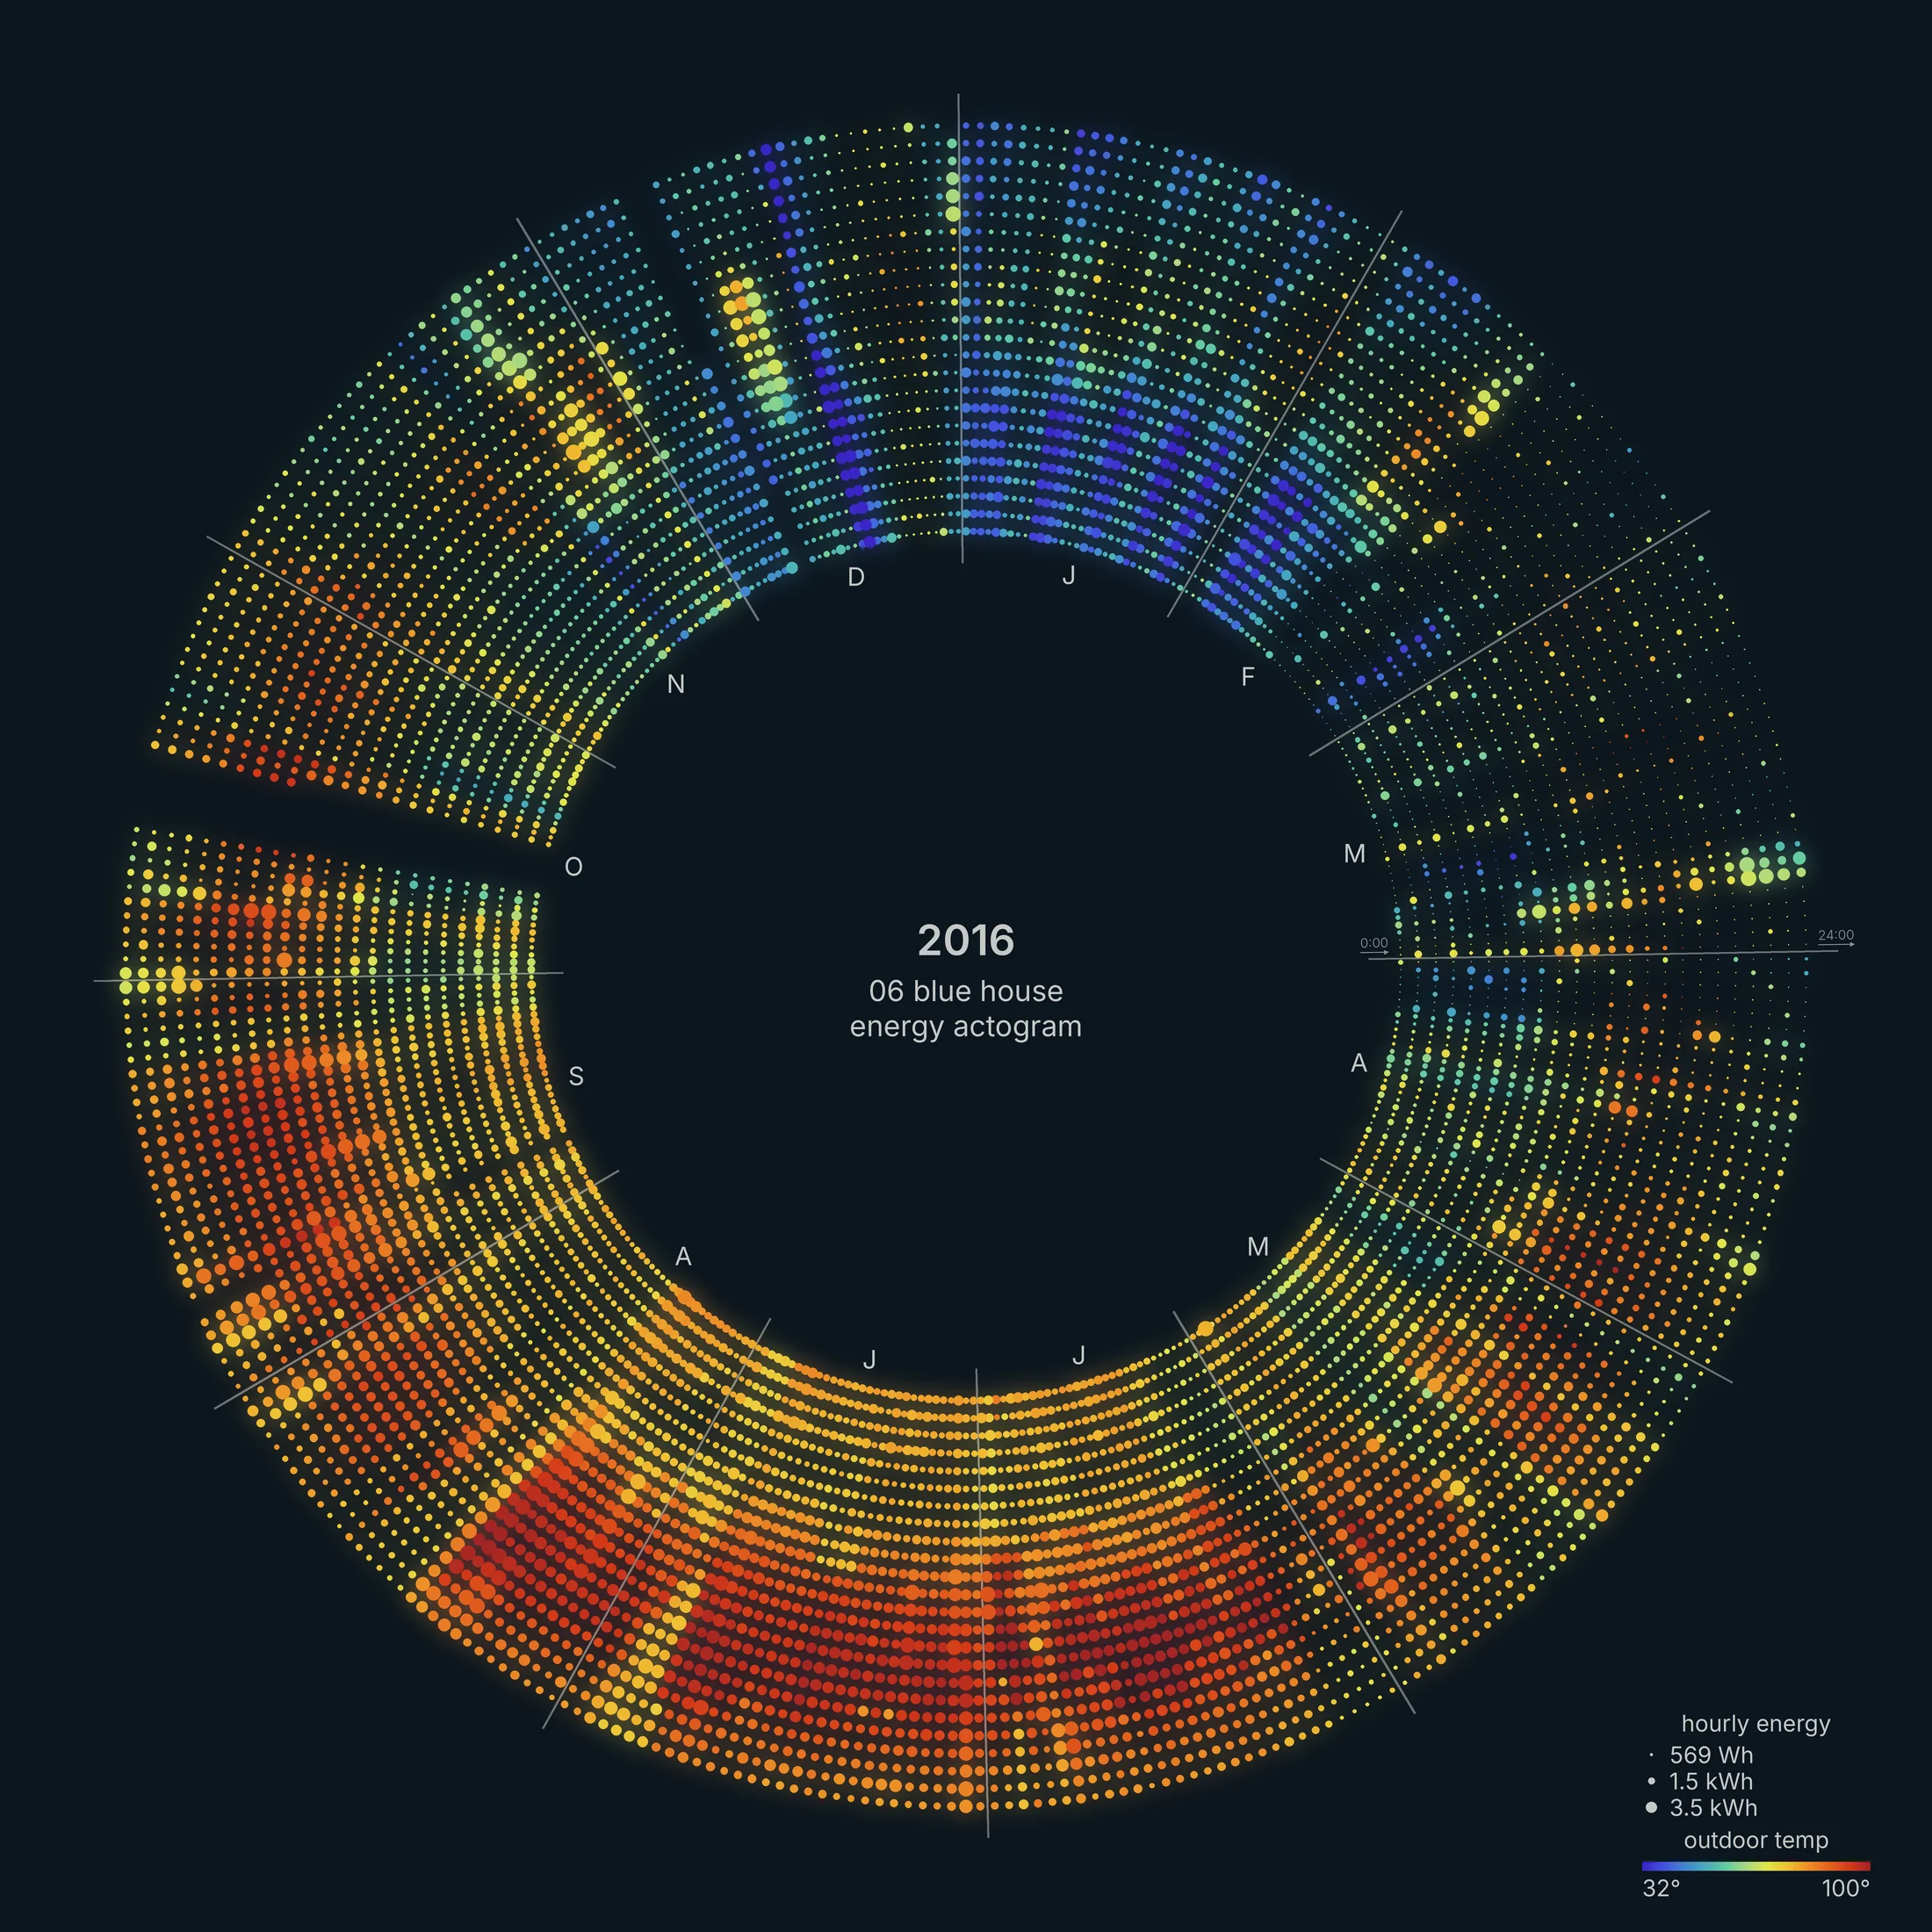
This part-time house in central Texas (2,700 square feet) has higher unoccupied loads and high HVAC loads, particularly on summer days and winter nights. About 37% of its days look occupied. The eMonitor stopped recording for six days in October.
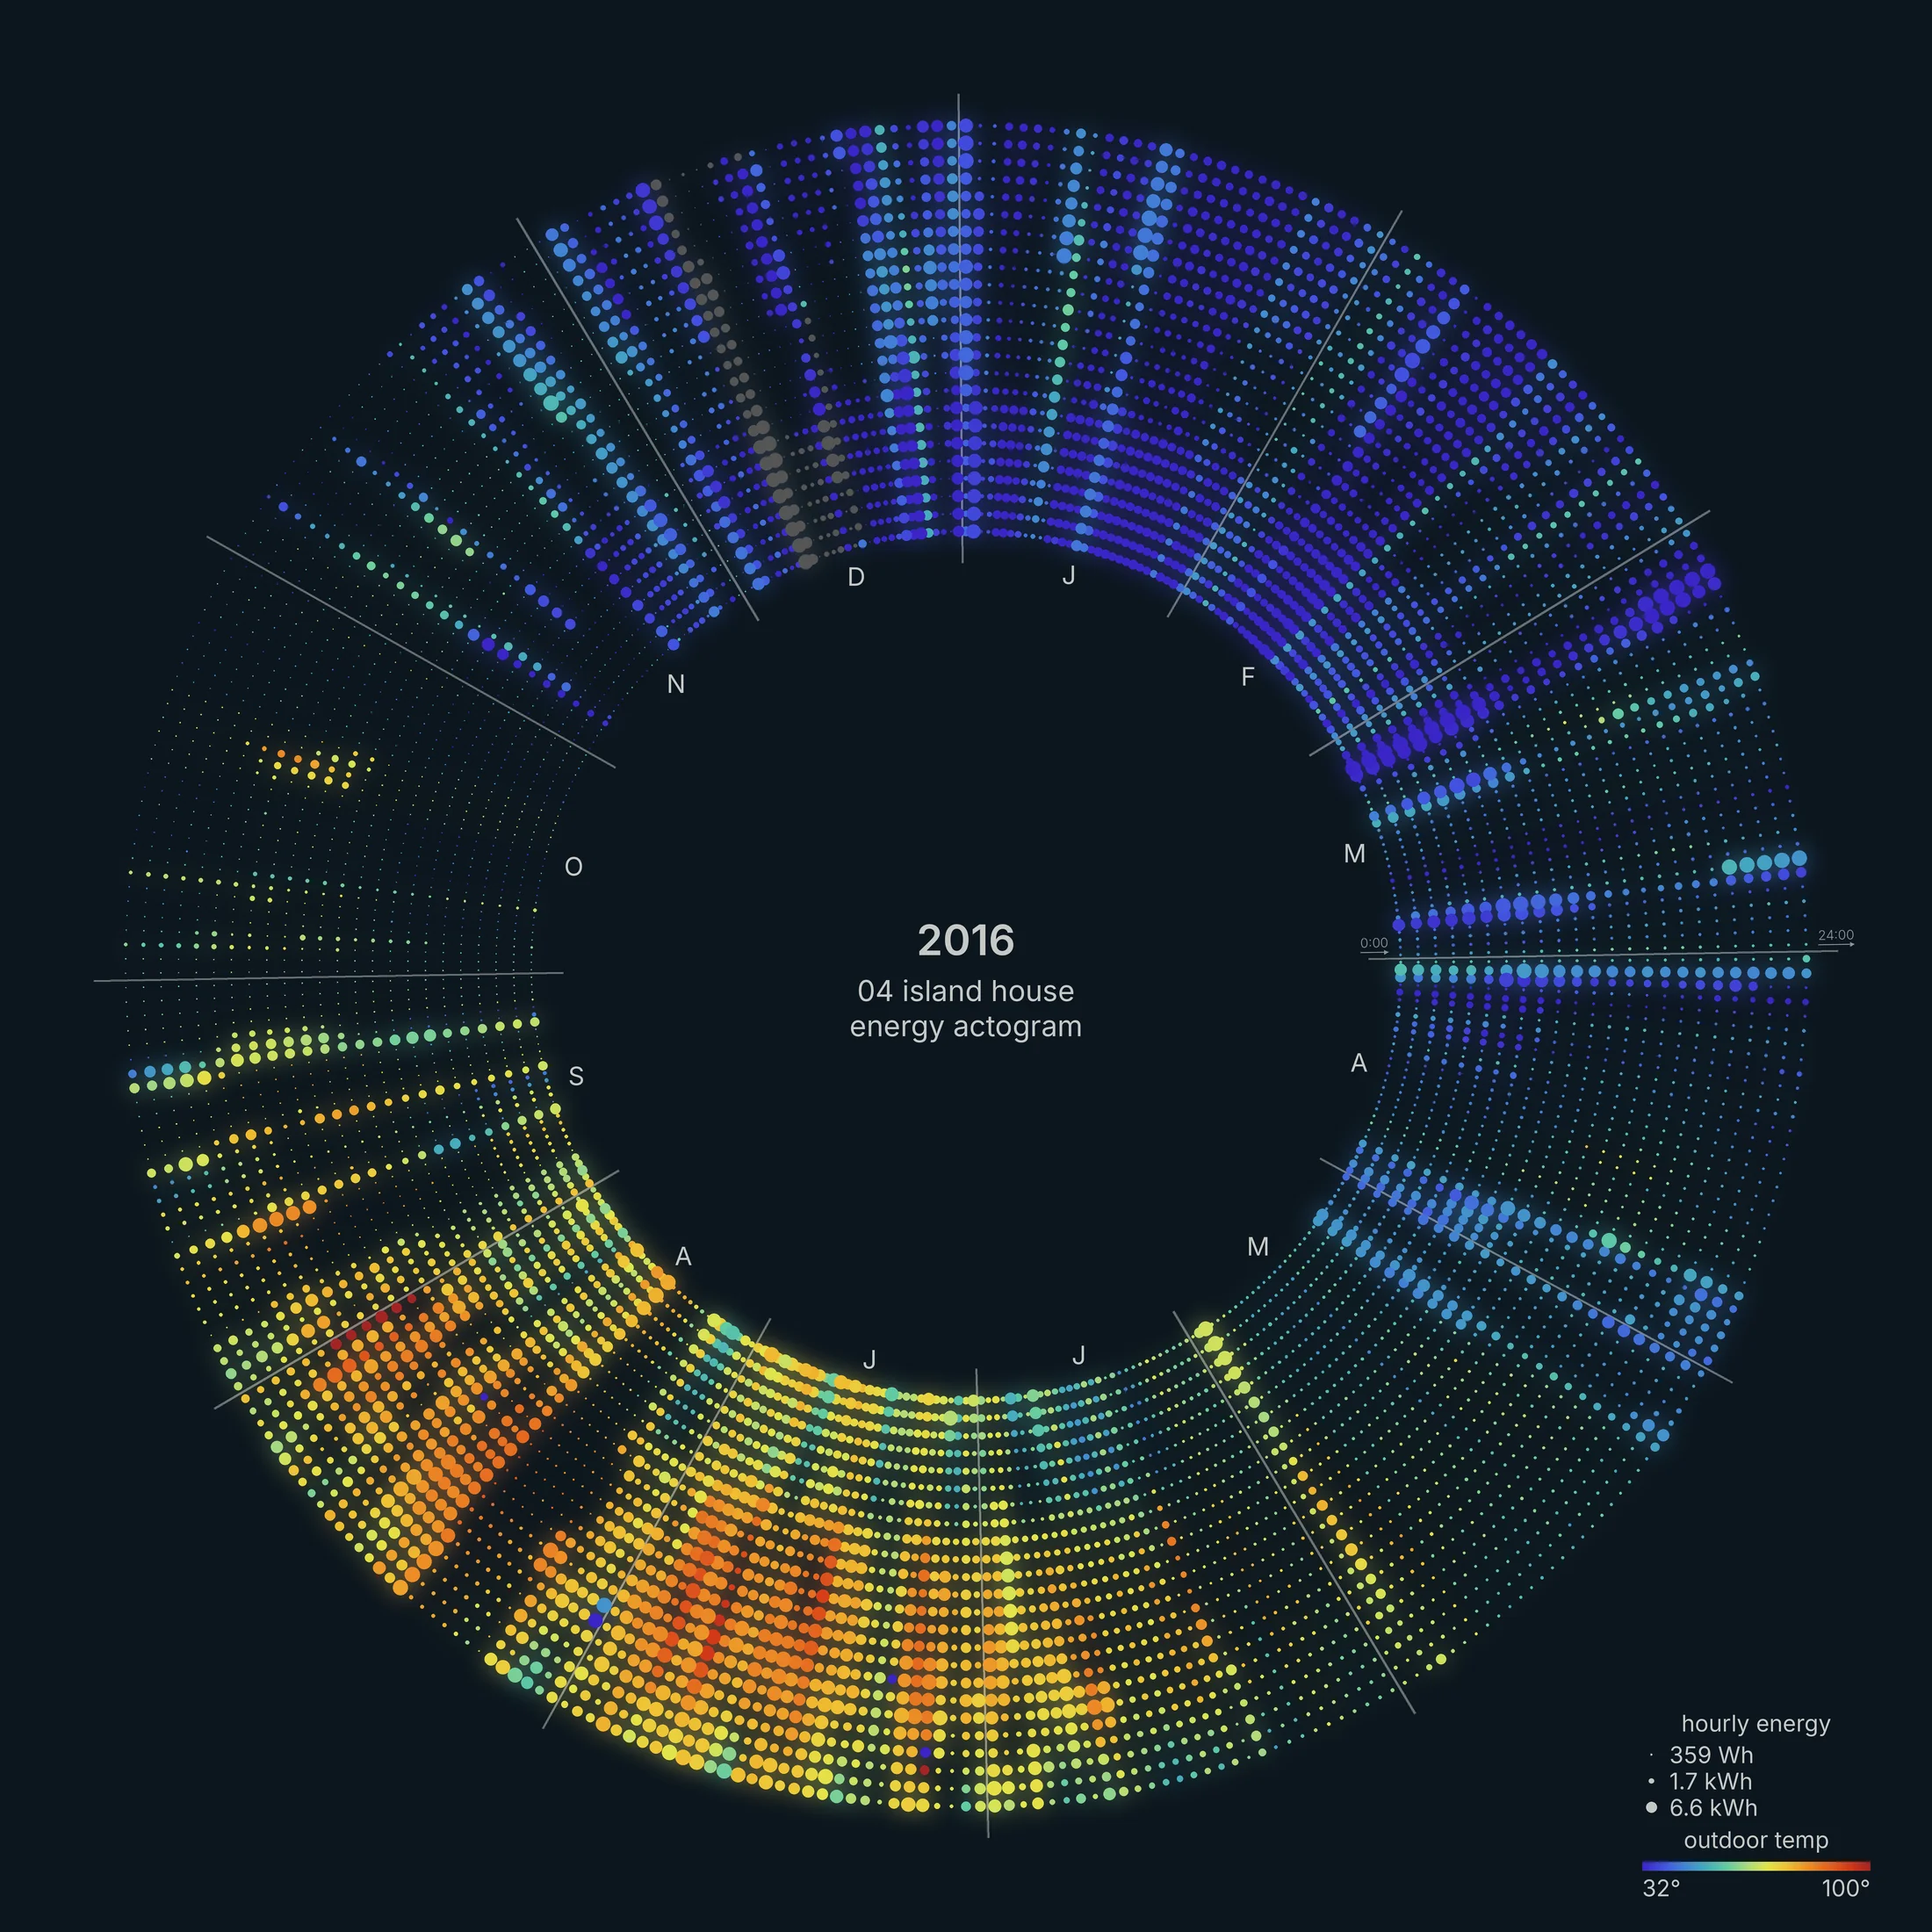
This house in New York (4,800 square feet) is a clear example of a part-time home. Through the winter the calendar breaks into short bursts of large blue dots, separated by quiet stretches. Temperatures are noticeably cooler than Texas
Offices
This 17,000 square foot office shows a typical commercial pattern. Energy use picks up around 8 am and drops after 6 pm, from about 15 kW overnight to 44 kW in the middle of the afternoon. The 5-day work week reads as five bright spokes and two dim ones. Weekends use about half the energy of a weekday.
Holidays break the pattern. Memorial Day, Columbus Day, Thanksgiving, the days after Christmas, January 2 and Martin Luther King Day all show up as dim weekday spokes.
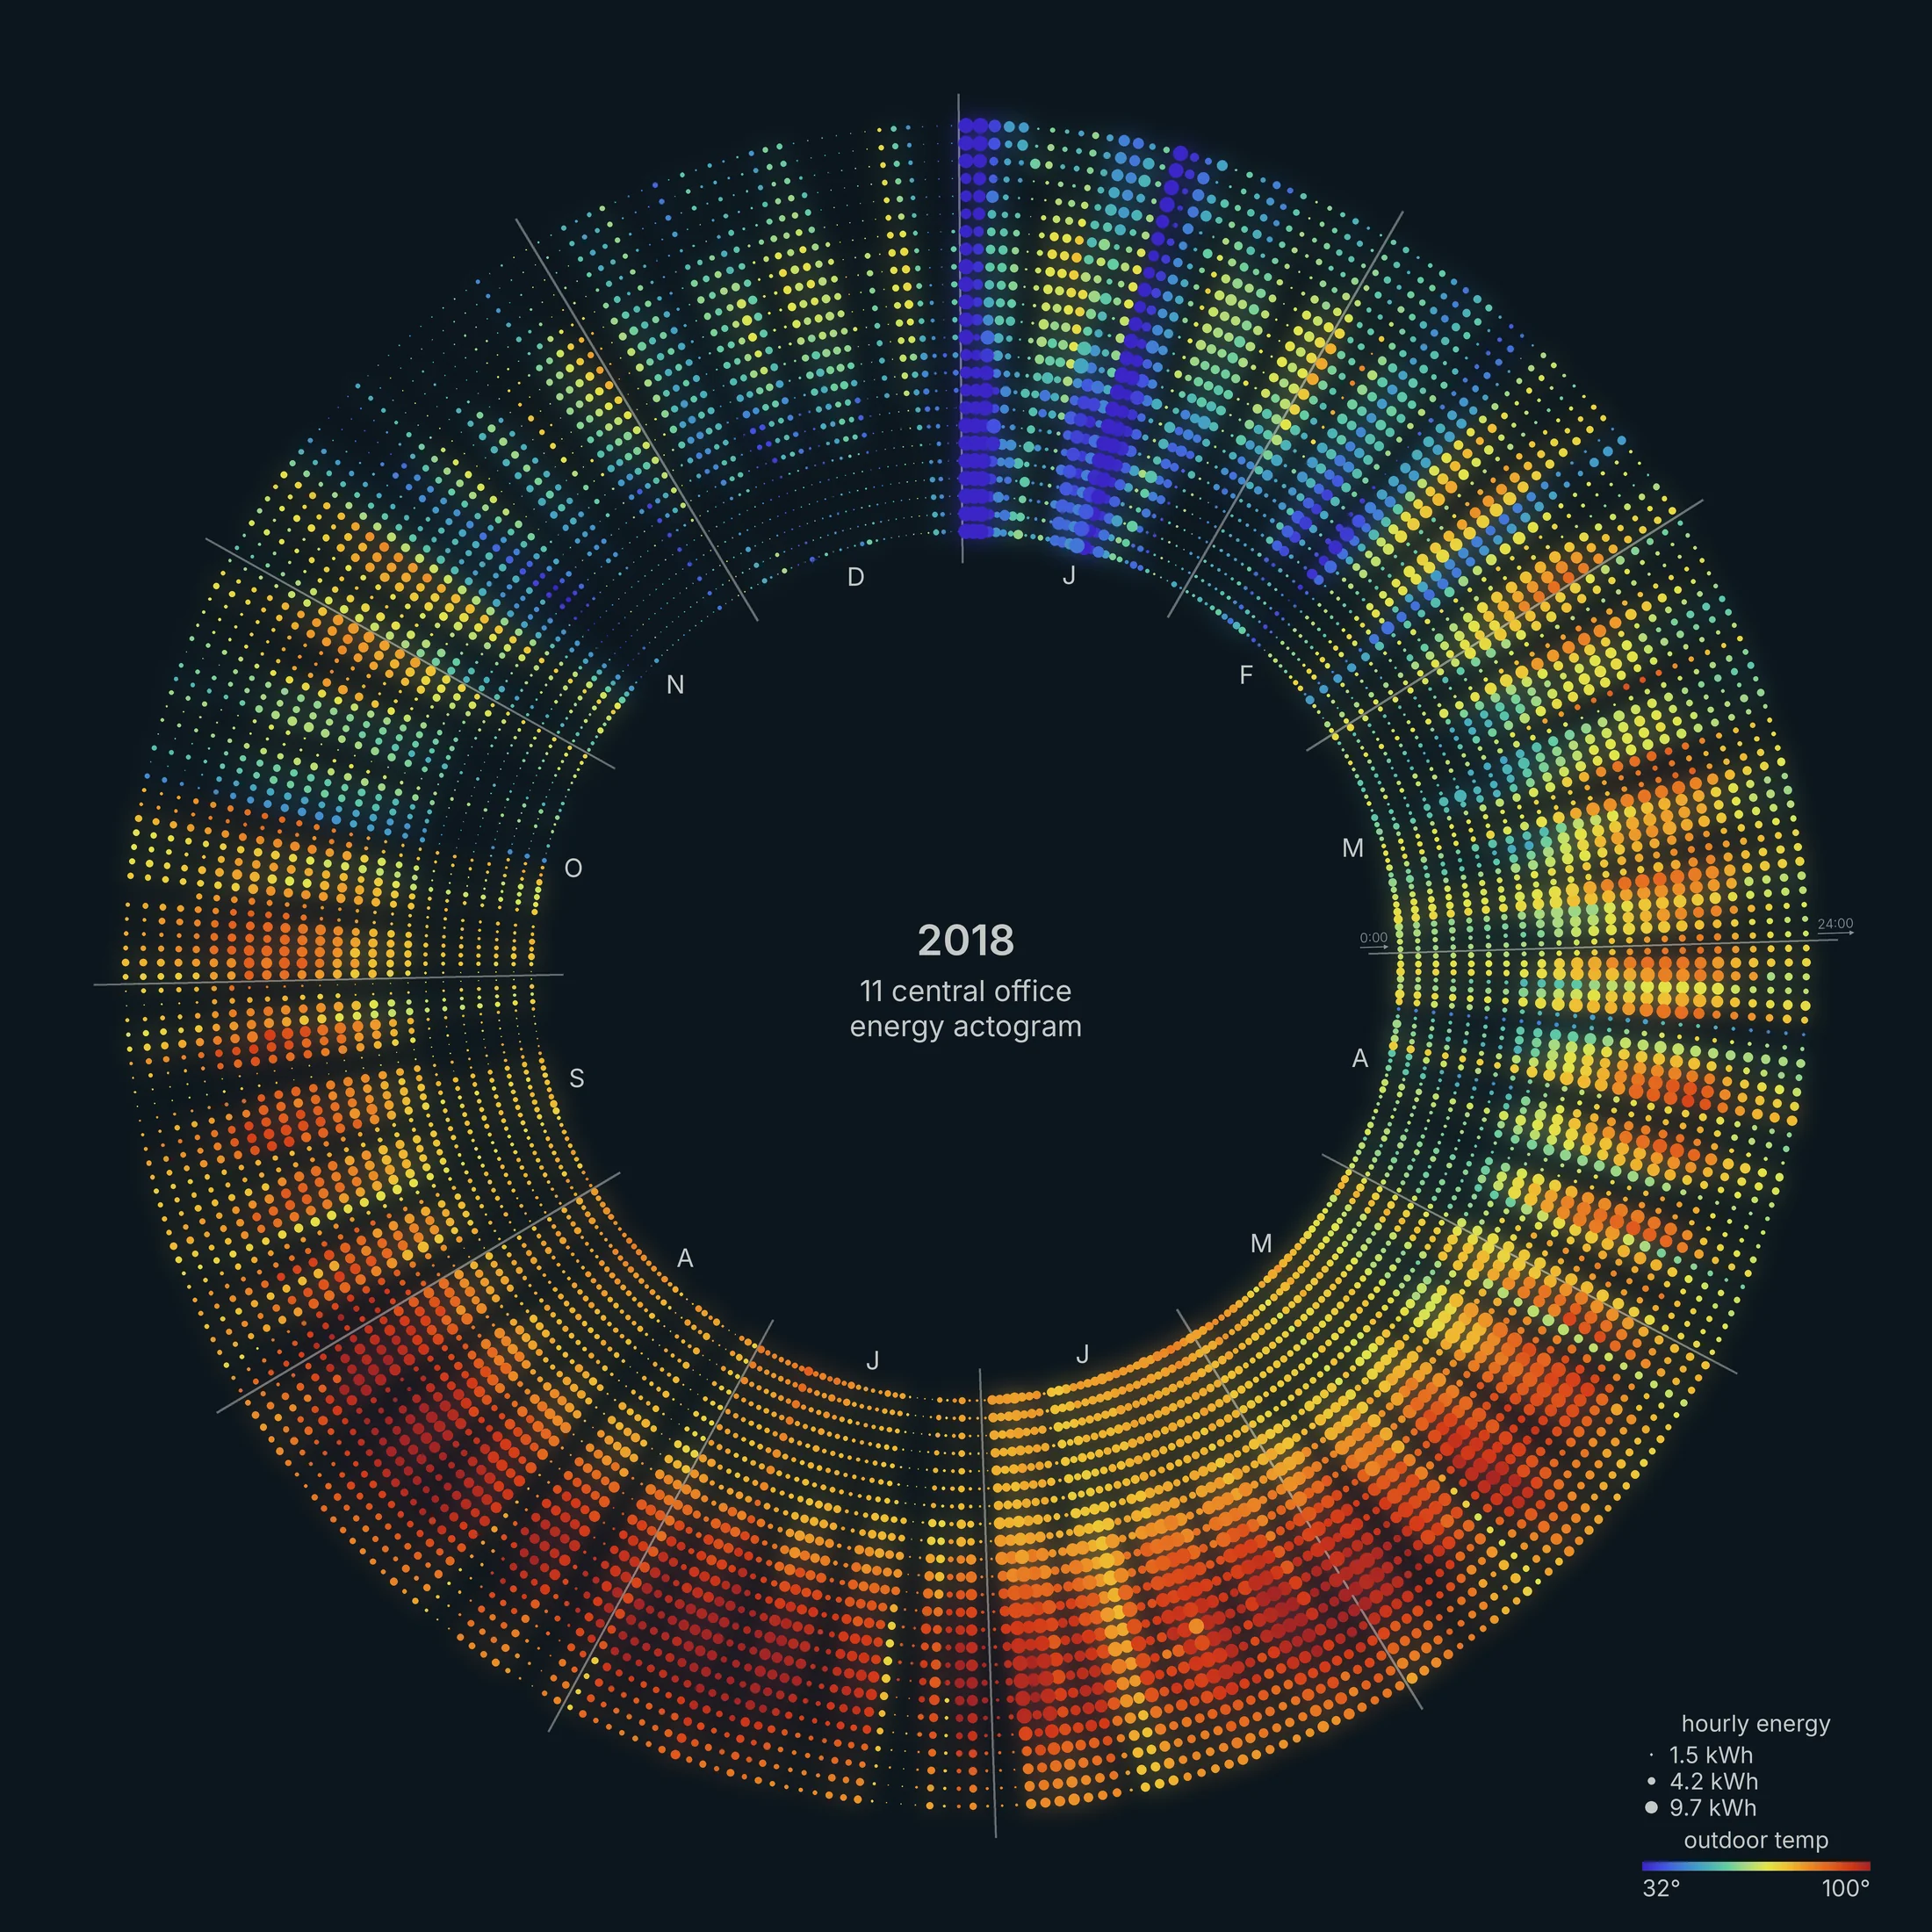
A smaller office (4,000 square feet) with the same weekly rhythm. Its holiday record is even cleaner. Thanksgiving, the day after, Christmas Eve, Christmas Day, New Year's Eve and New Year's Day all drop to between 22 and 41 kWh.
The bright blue band in early January is the 2018 cold snap. On January 1 and 16 (about 30°F), the office used 290 and 343 kWh, close to three times a normal day.
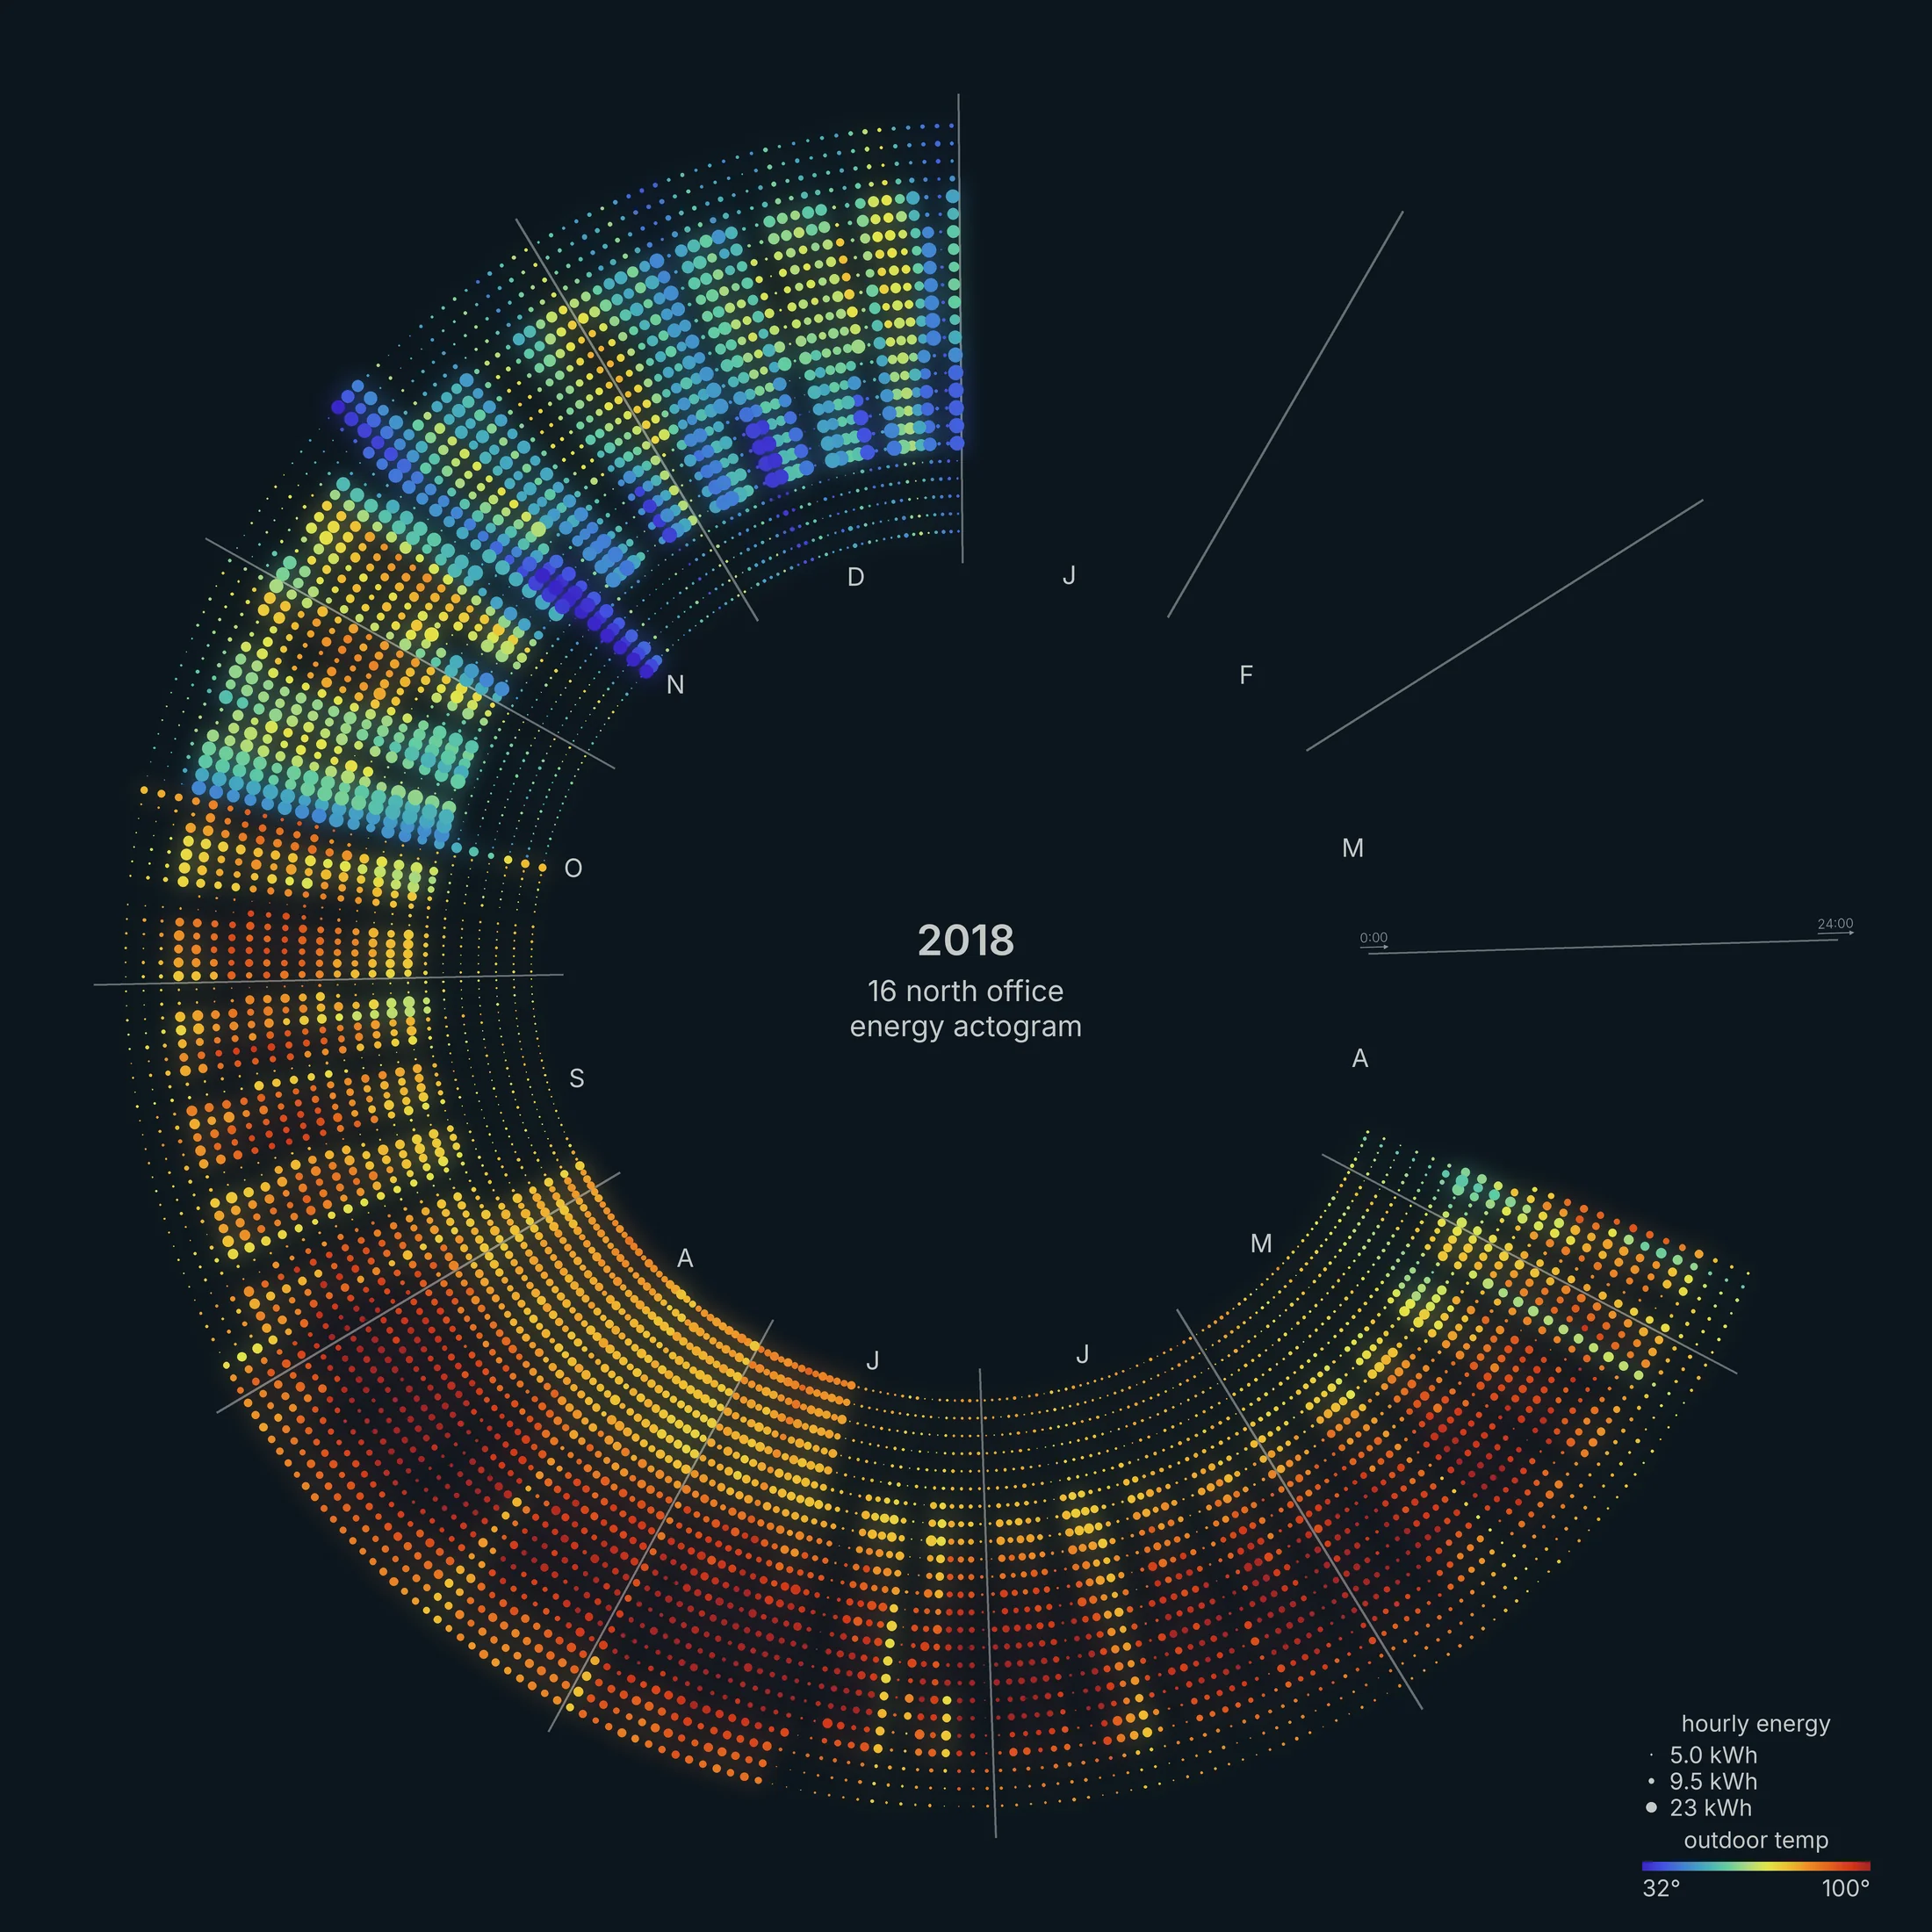
A much larger office (54,000 square feet). The winter spokes look different from every other office: large blue dots crowded into the early morning hours. On winter weekdays the building idles at about 5 kW overnight. Then it jumps to about 37 kW by 6 am and tapers off through the day.
That's the heating recovering from a night setback (a lower overnight thermostat setting). In summer the same hours stay flat at 10 to 13 kW, because the cooling isn't on this meter. A 7-fold morning spike probably sets the building's peak demand charge, so it's a good candidate for a staggered start.
Pavilions
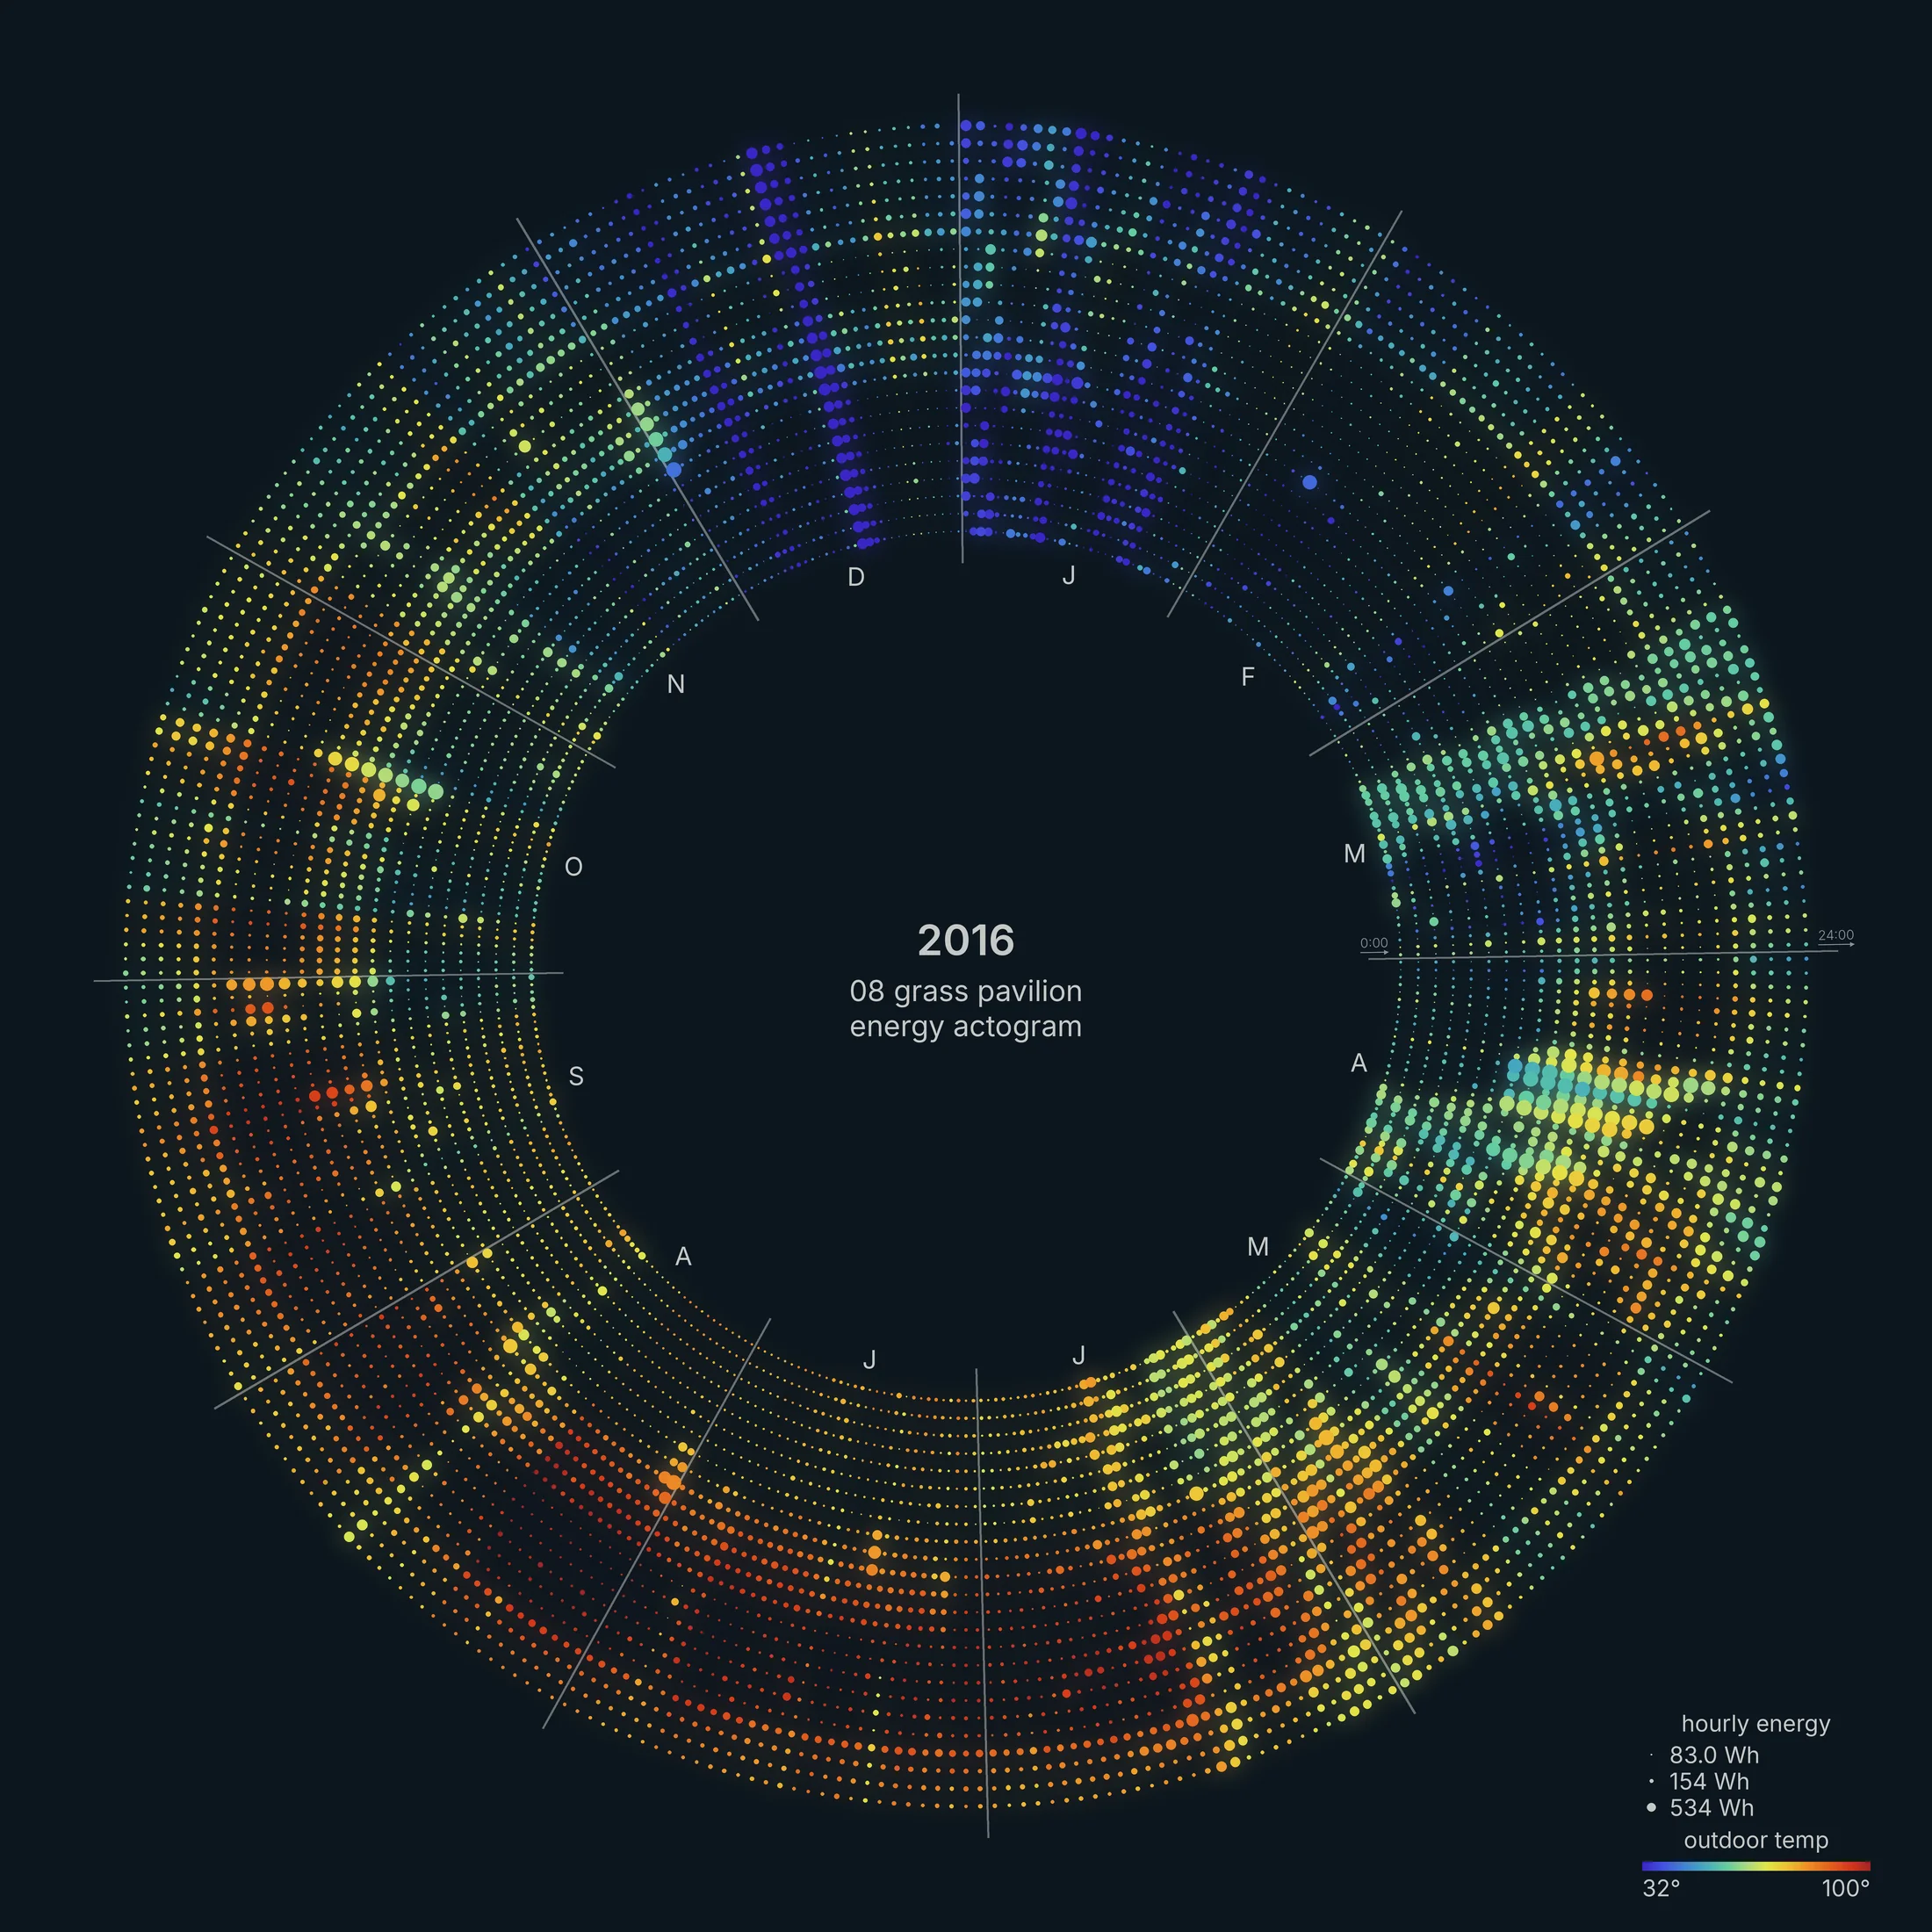
Energy use from an open-air pavilion in north Texas (5,000 square feet). A solar array produces more energy than the pavilion uses, making it a net-positive energy building. In 2016 the array produced about 3,960 kWh and the pavilion used about 1,830 kWh.
Most of the year the dots are tiny. Energy use from water treatment and pumps peaked in April during the heaviest rains of the spring. In 2015 the same pumps ran even harder in April and May (May 2015 was the wettest month on record in Texas).
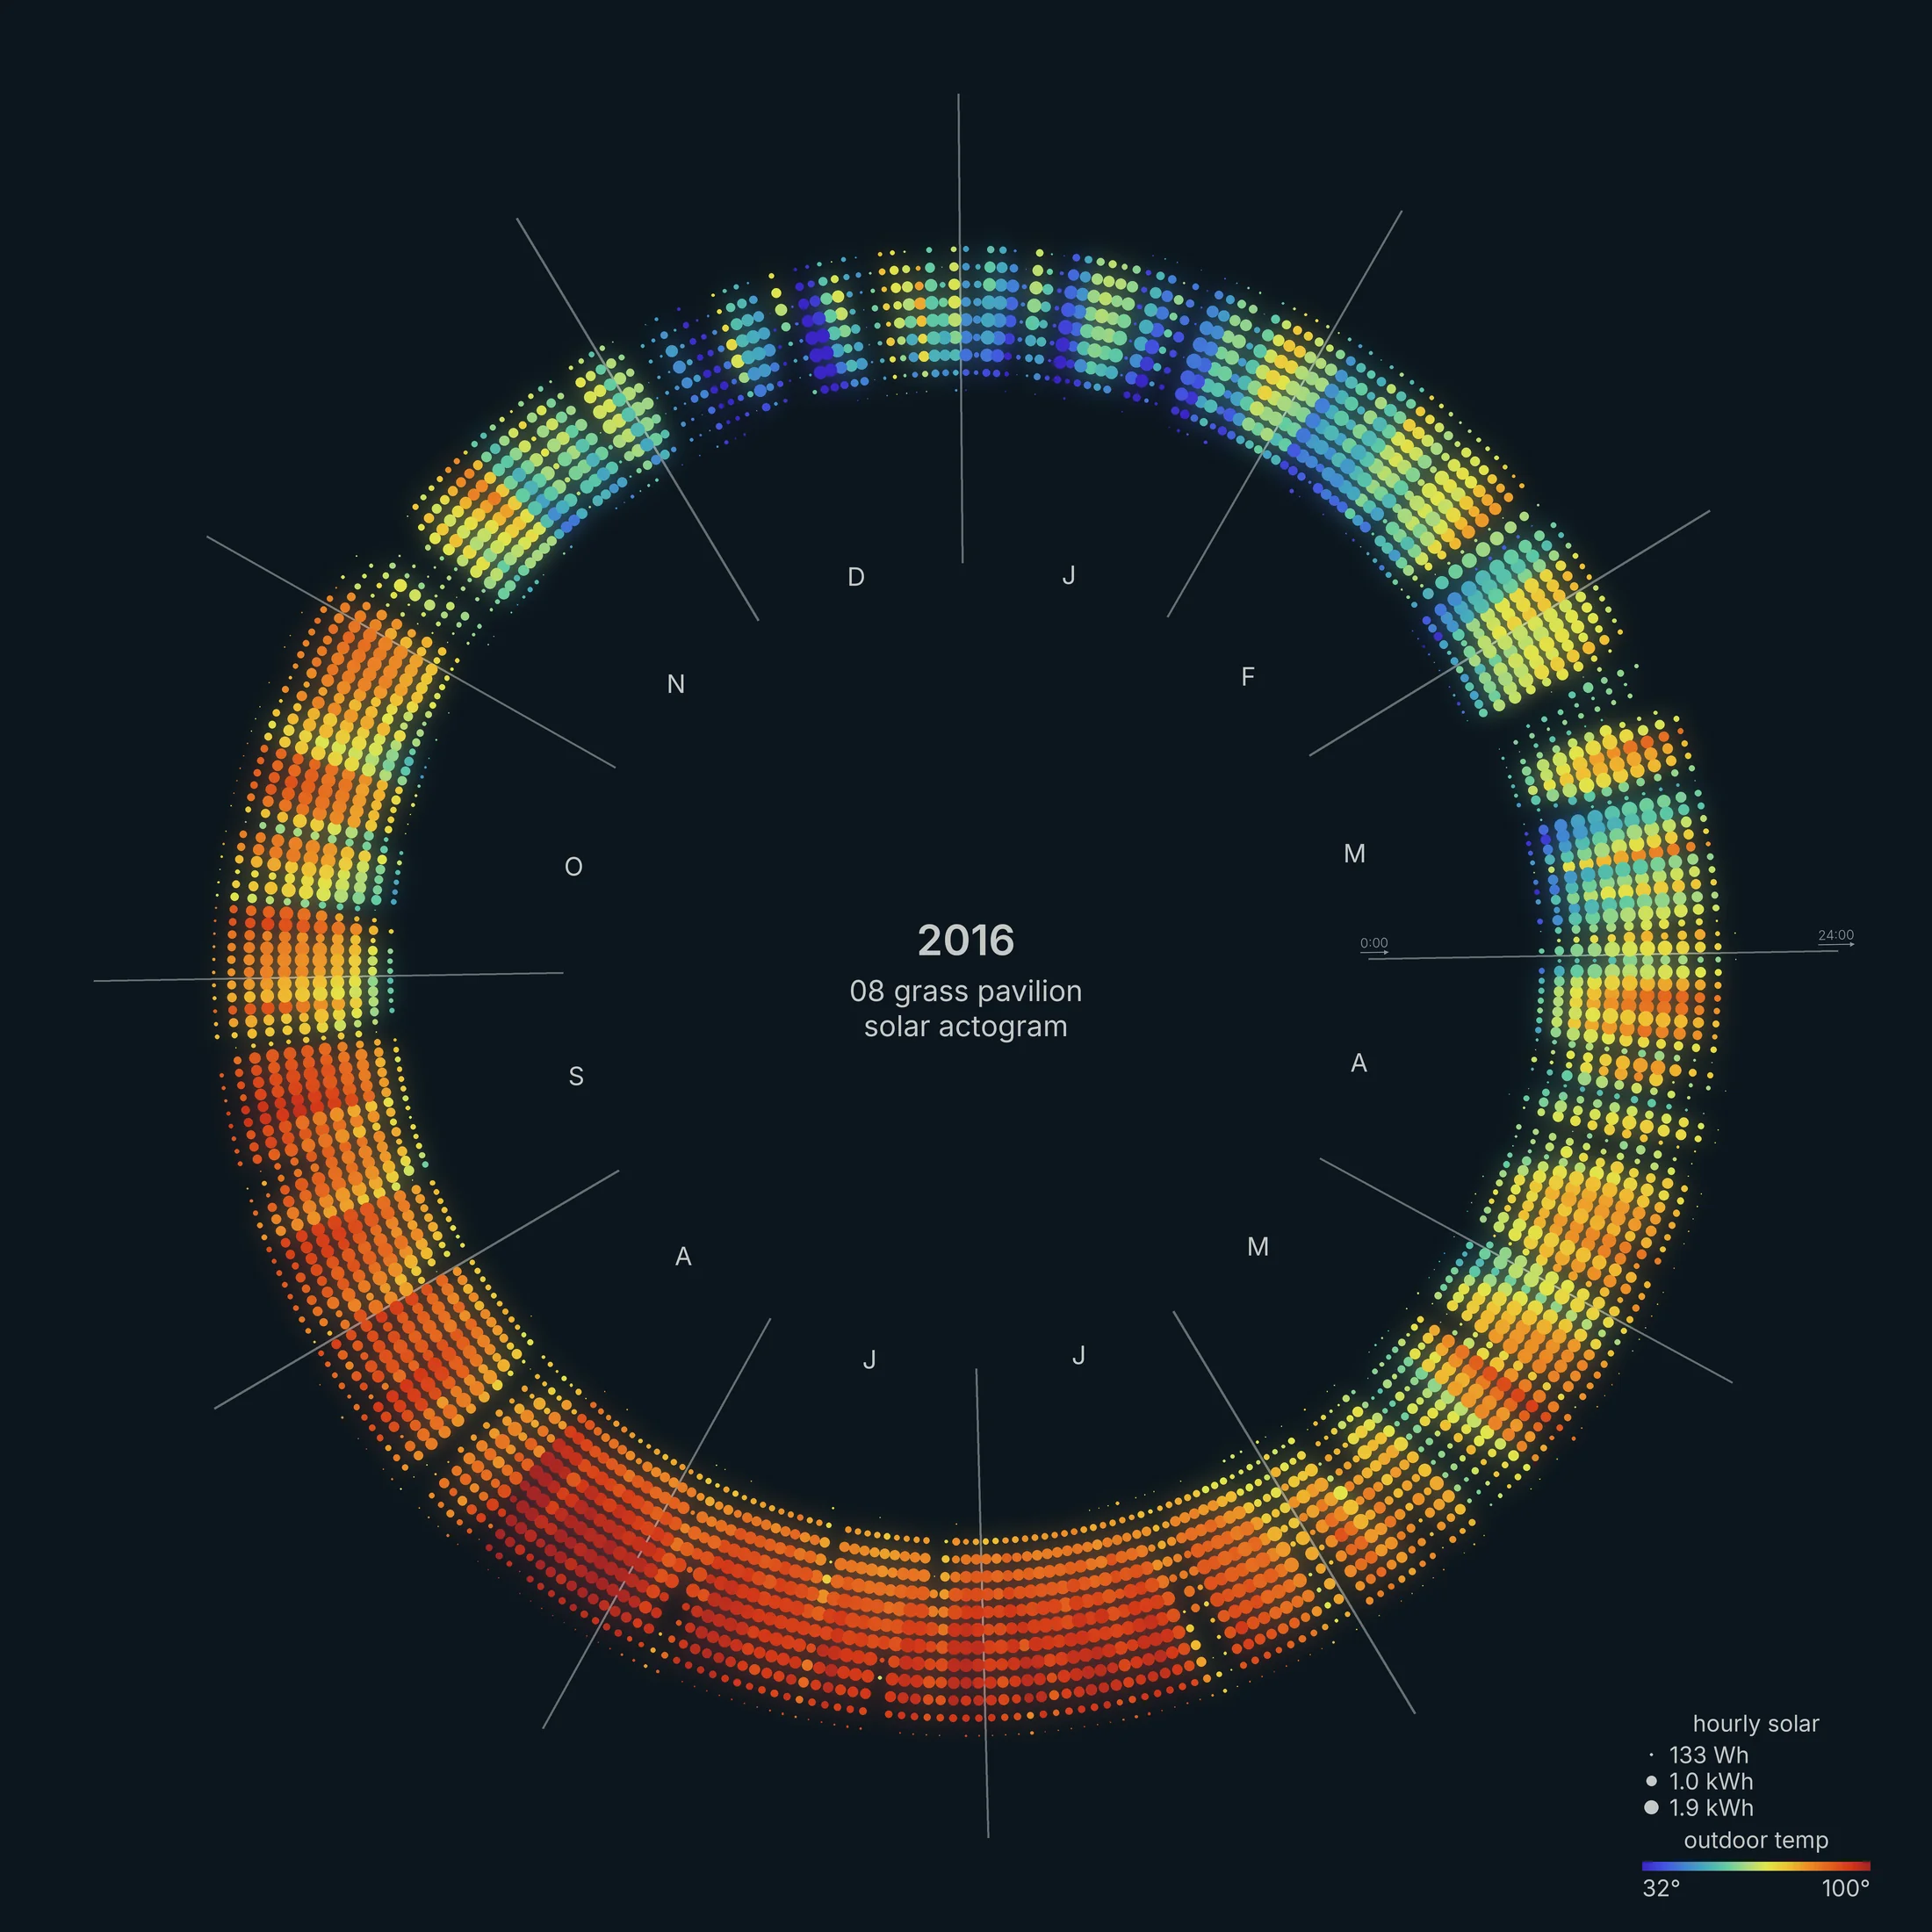
Plotting energy production from the solar array shows a ring during daylight hours. Days lengthen from about 8 hours of production in December to 12 hours in June. The same April rain that ran the pumps also cut solar output, to about 3 kWh on April 17. Long days and low cloud cover make summer the most productive time of year.
The solar calendars also show daylight saving time. Clock time shifts by an hour relative to the sun, so the band of production steps outward one ring in March and back in November.
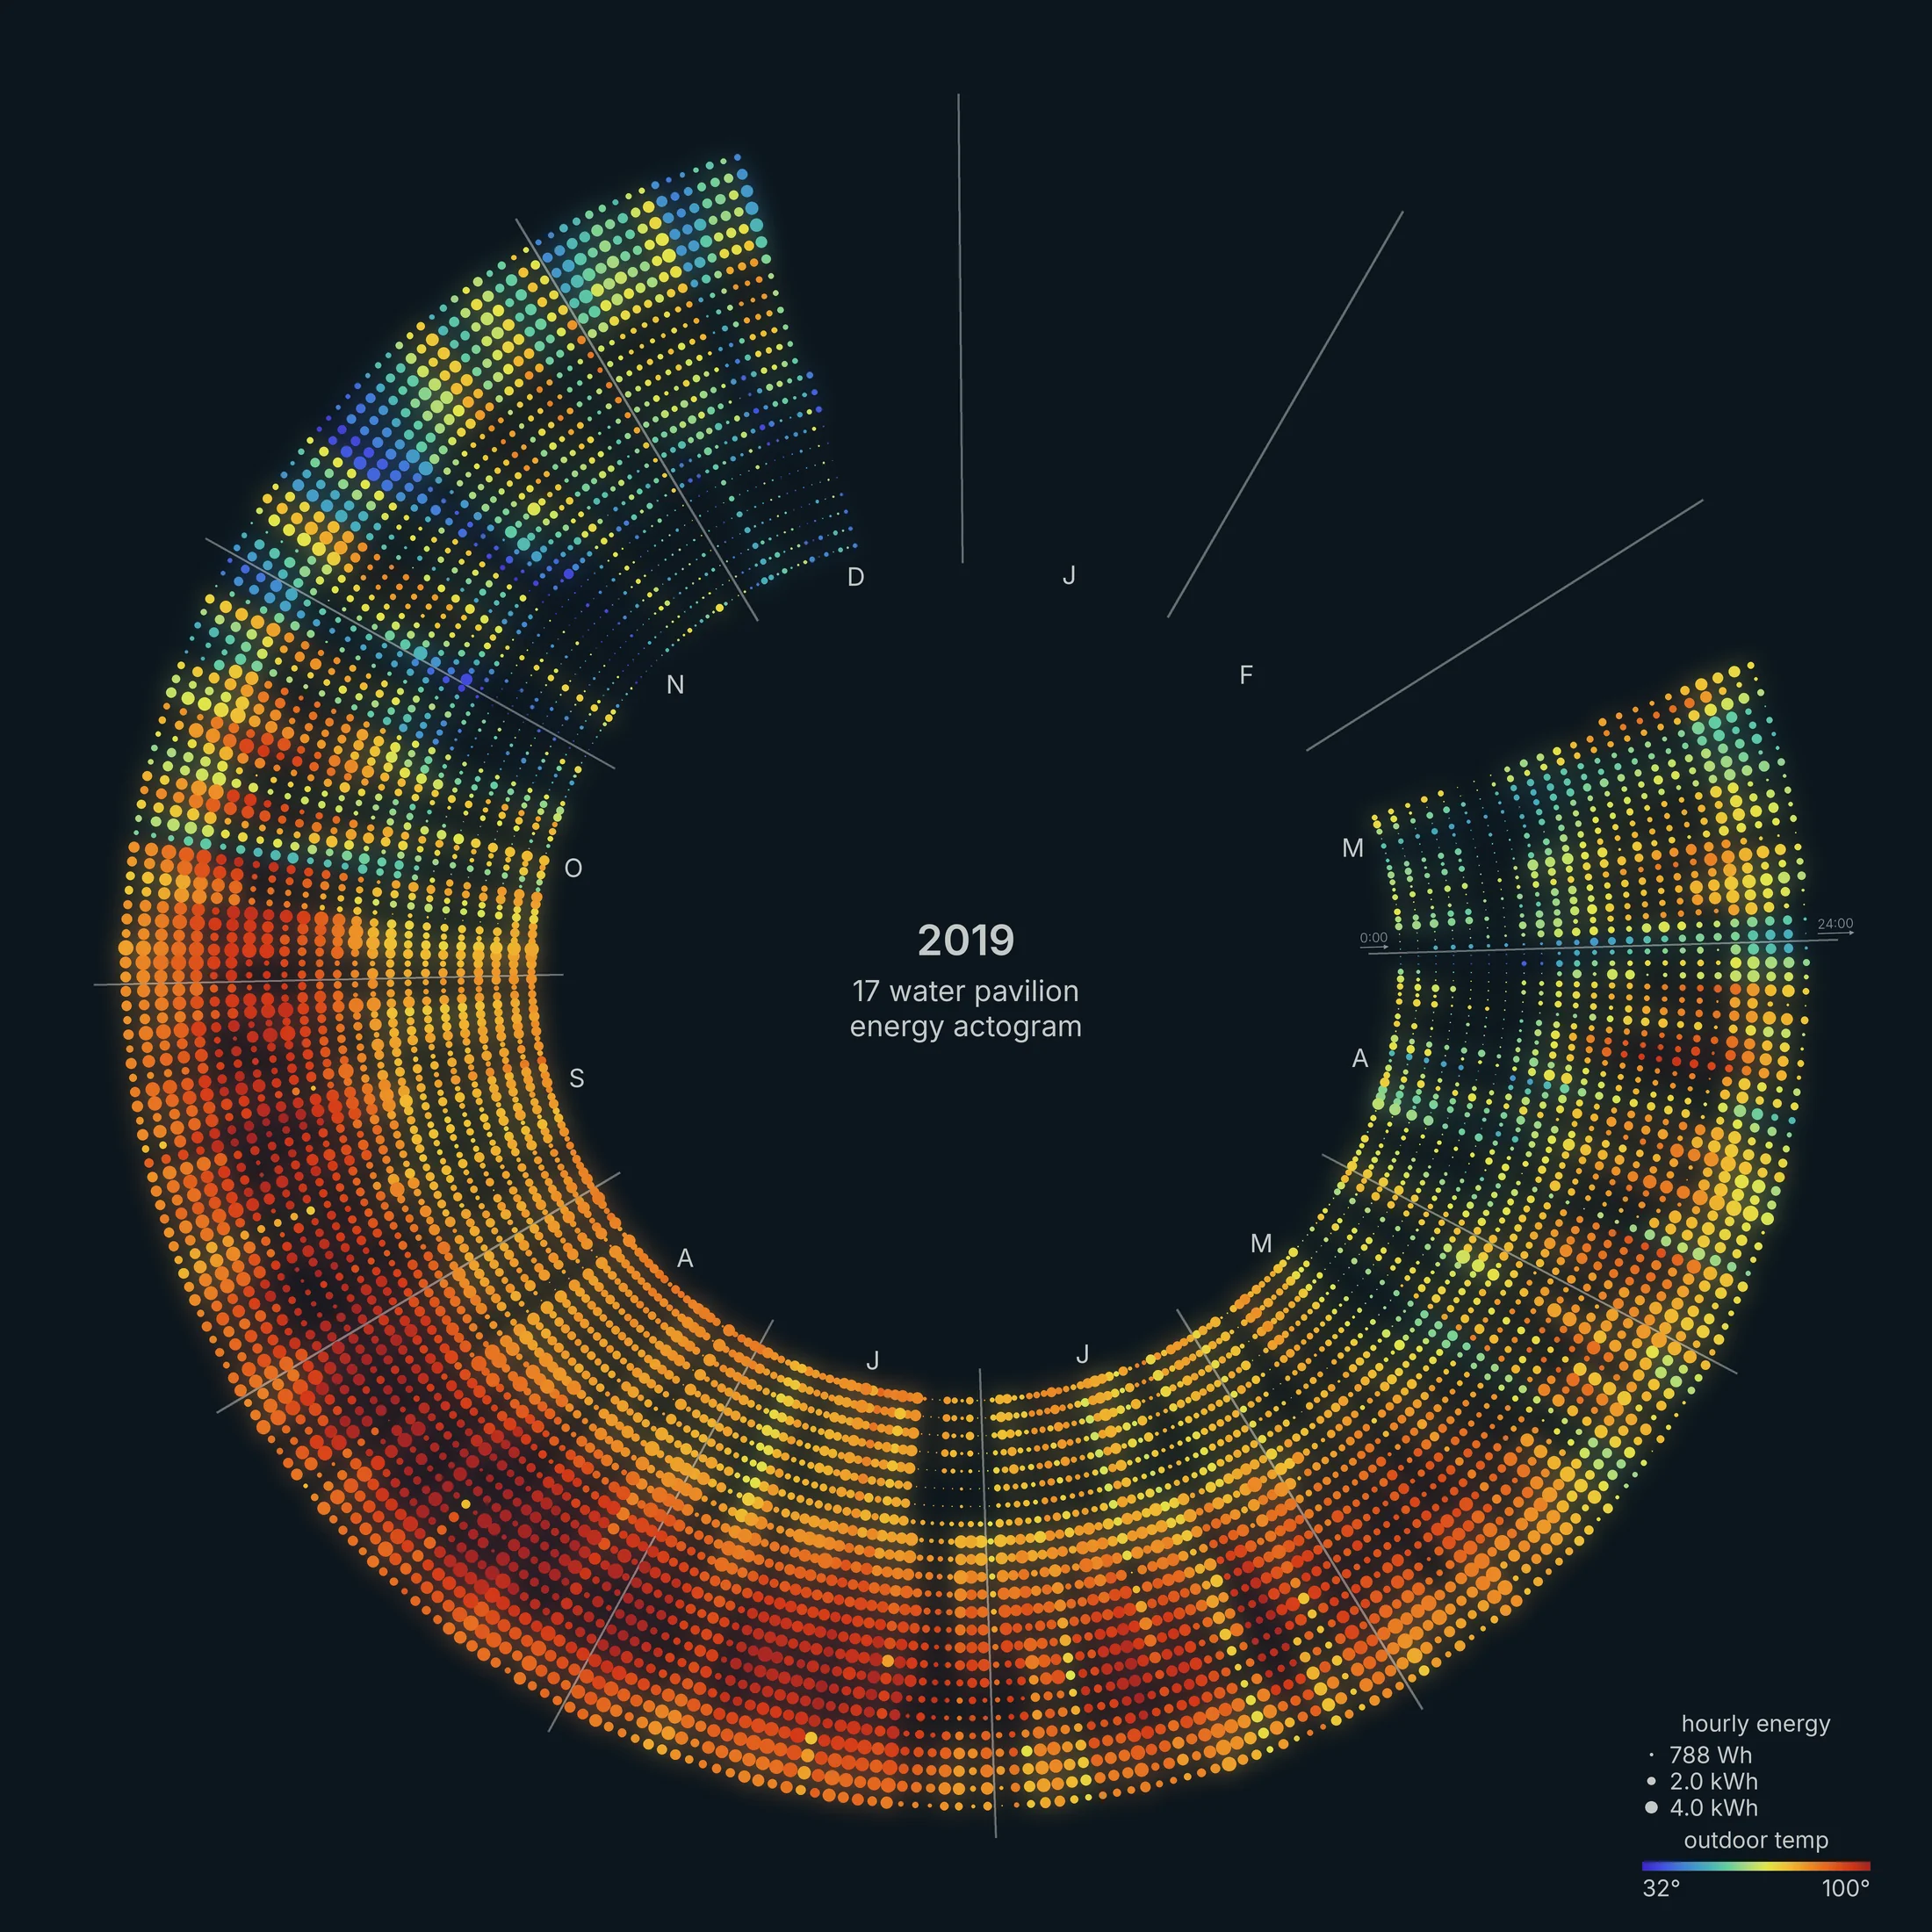
A small pavilion in central Texas (2,000 square feet), also with solar and nearly net-zero. Its busiest hours are 8 to 10 pm, all year: evening lighting and events.
Process, old and new
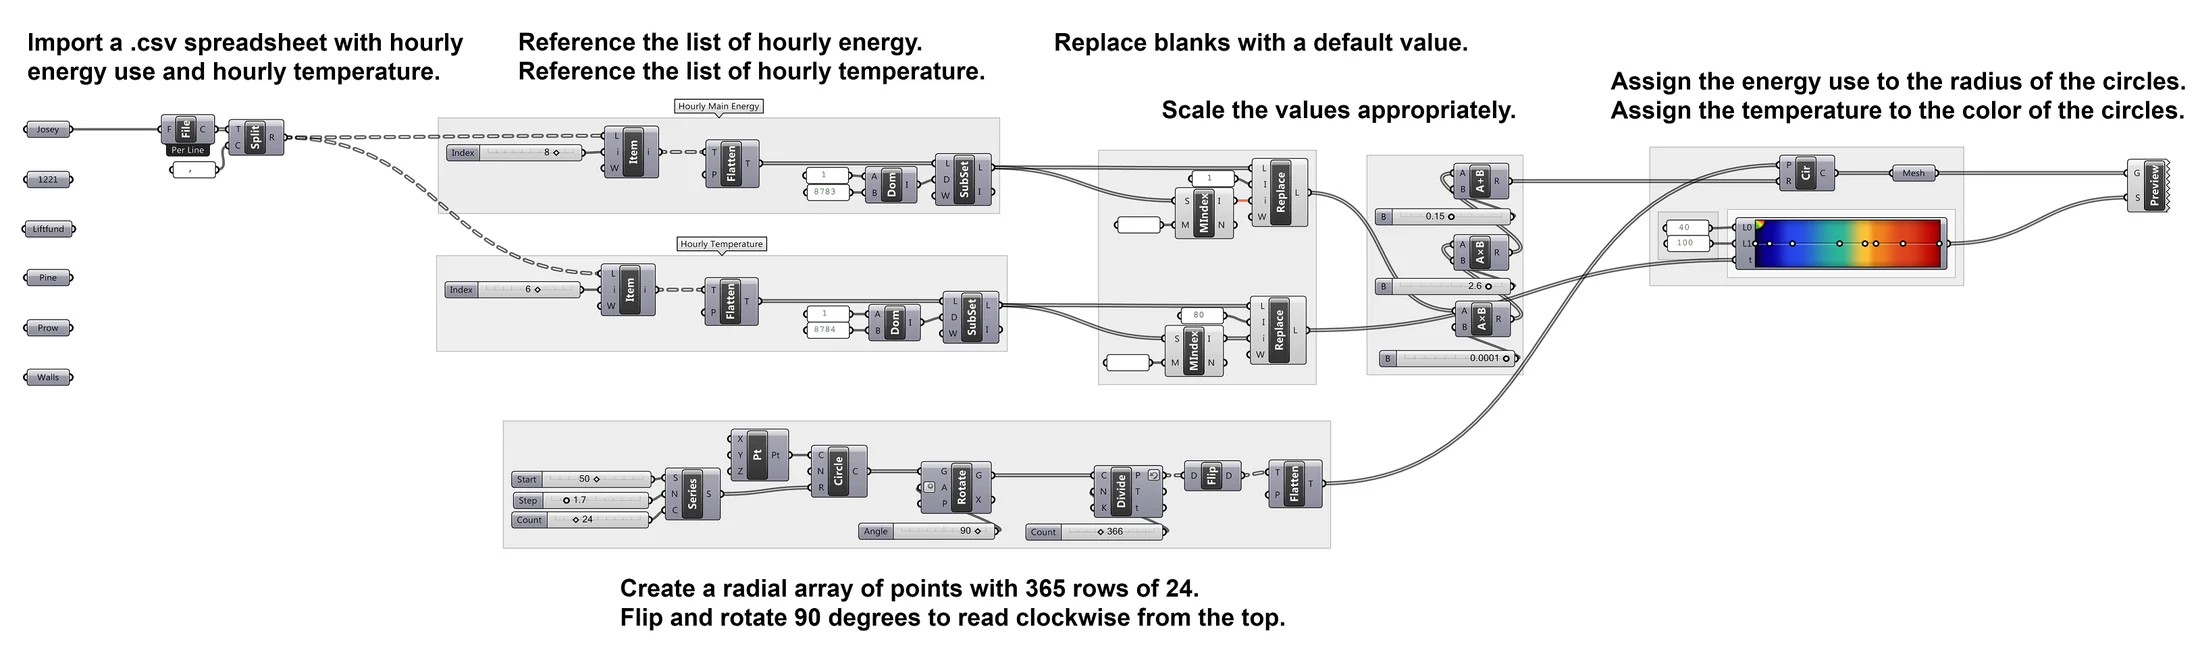
What changed since 2017. The first version was a Grasshopper script in Rhino. I used to do everything in Grasshopper. It was fantastic. Consider it a gateway drug to Python.
Now it's a Python script (pandas databases, much better data hygiene, Pillow for the drawing). Half the time was spent getting the color palette juuust right. See the Energy Signatures post for another way of looking at this data.