Macro-Economic Regime Flow - PCA
This model takes 36 US macro indicators and compresses them into a small number of factors through a PCA analysis. The first two dimension explain 42% of the variance:
- PC1, growth vs stress (22% of variance): positive with manufacturing orders, breakevens and job openings; negative with bank lending tightening, jobless claims and financial conditions.
- PC2, the monetary cycle (20%): positive with a steep yield curve and rising unemployment; negative with high policy rates, mortgage rates and wage growth.
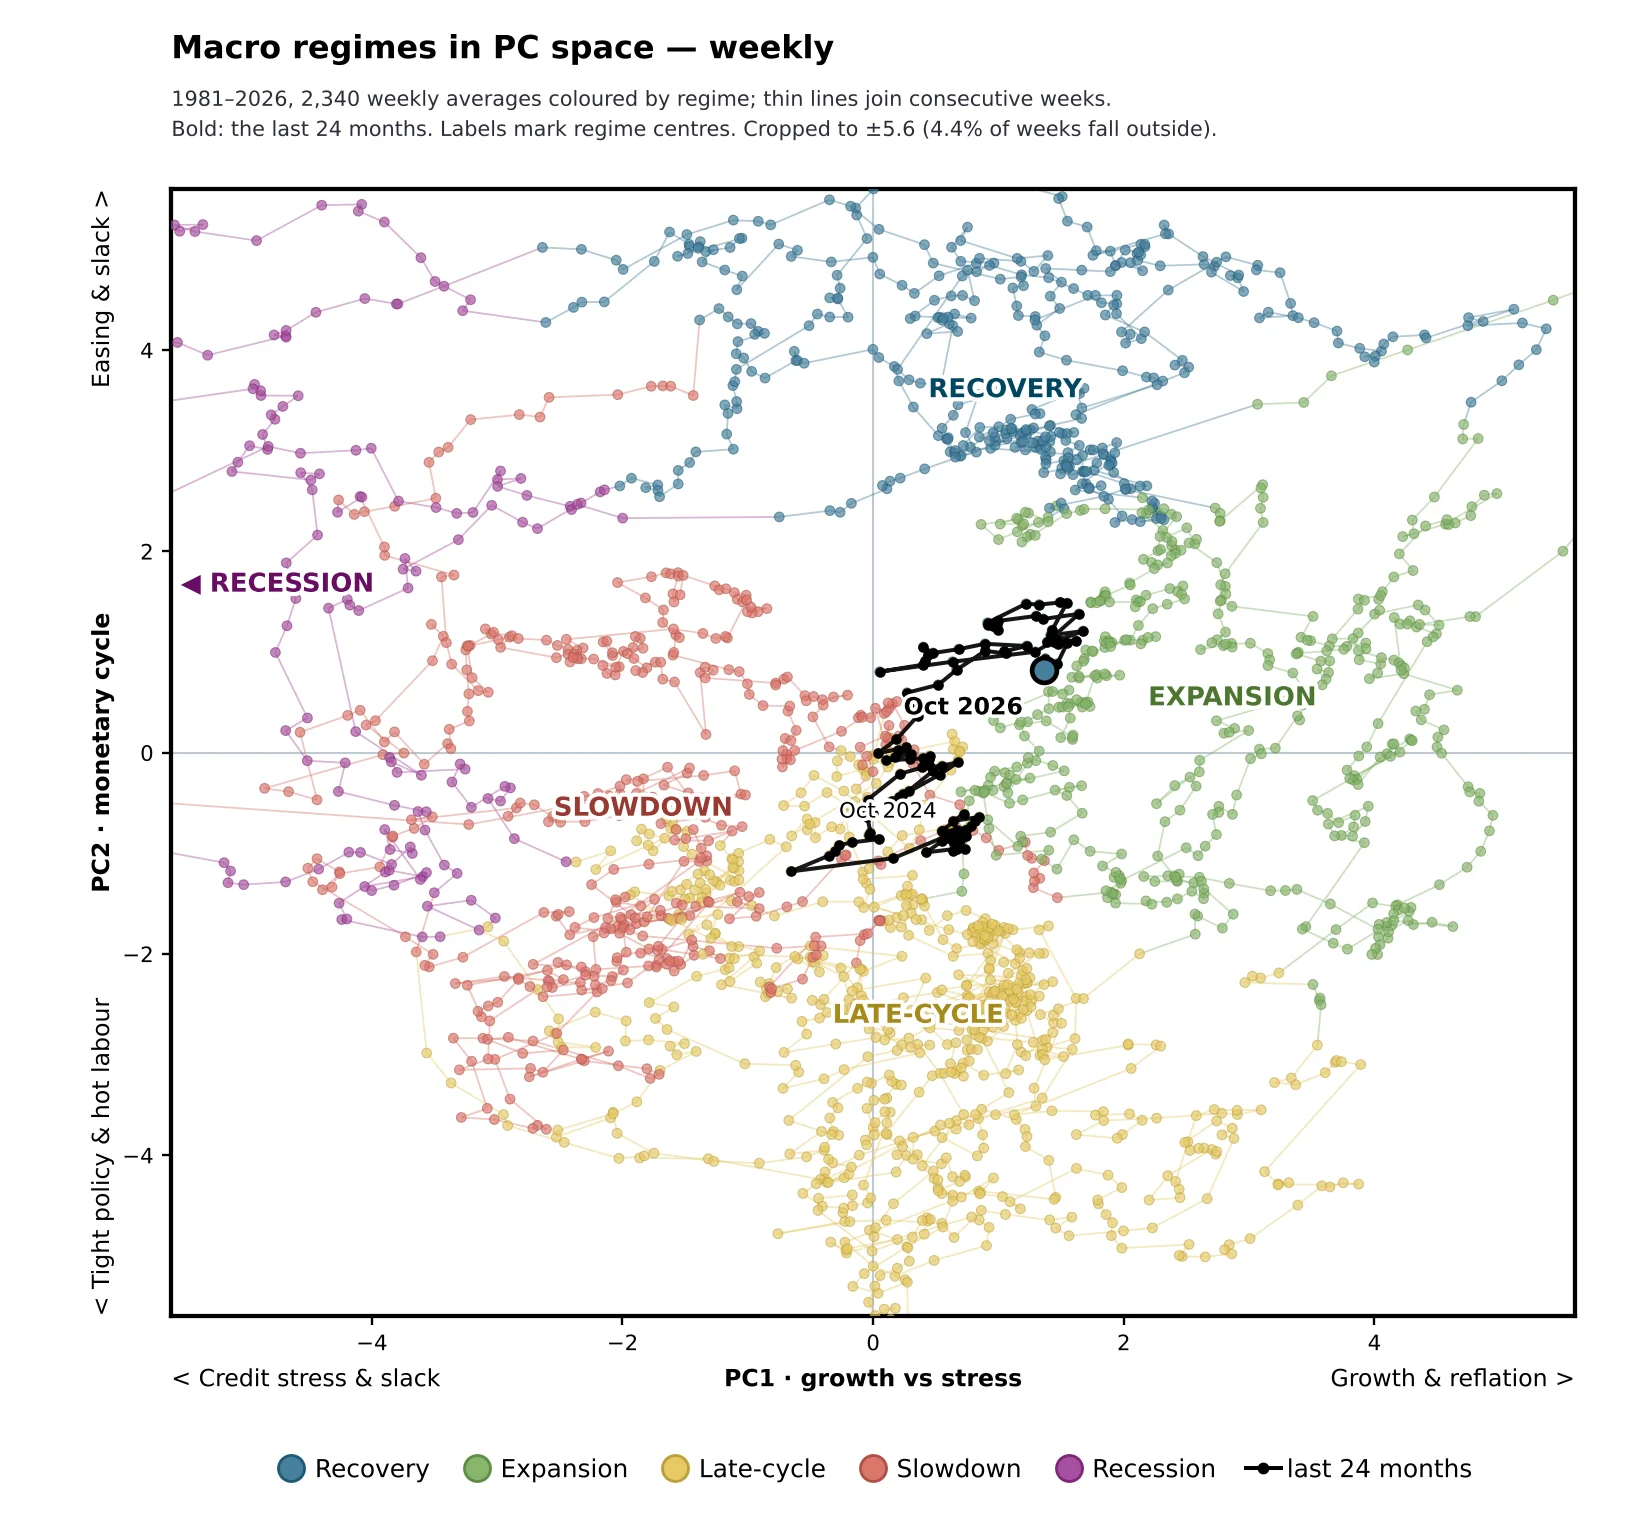
K-means clustering takes the first 6 PCs (67% of variance) and groups them into 5 distinct regimes: a cycle of Recovery, Expansion, Late-cycle tightening, Slowdown, and Recession. The weekly scatter plots every week since 1981 in the PC1/2 space, colored by regime, with the last 24 months drawn in bold. From this model, we've recently been in an uncertain mini-cycle from Late-cycle > Slowdown > Recovery > Expansion. Growth/Monetary Cycle quadrant models are commonly used, and this PCA confirms something similar. Without tuning the PCA, early drafts showed an era effect where one regime was just a block of 1980's conditions. Without capping z-scores, other models get dominated by Covid and GFC crashes.
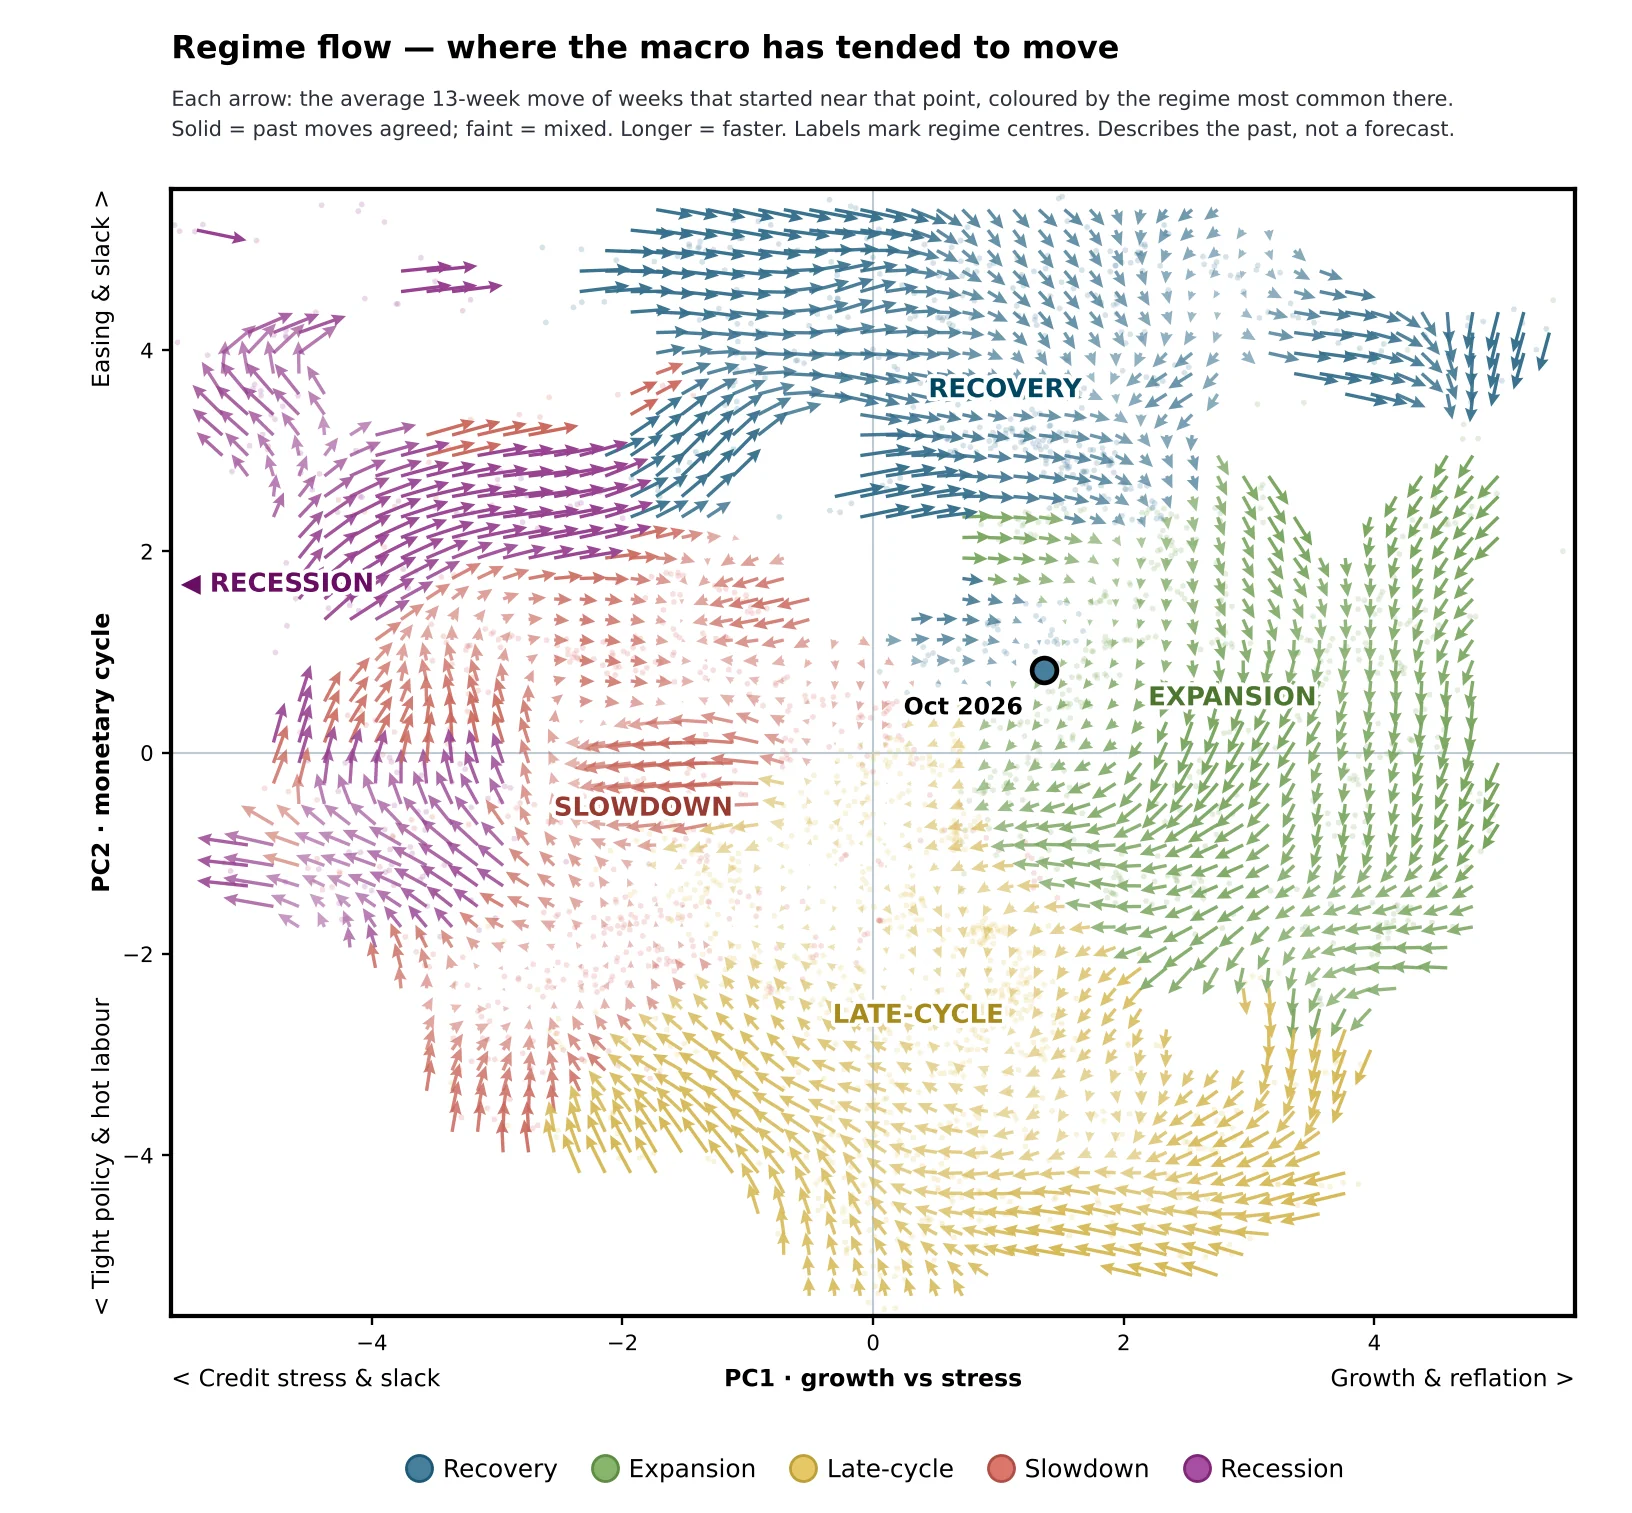
The vector flow chart averages the 13-week move of all weeks that started near each point. The overall clockwise business cycle is apparent, with regions of uncertain movement in the middle. Arrow opacity shows how consistently past moves from that point agreed. As of October 2026, the series sits between the Recovery and Expansion clusters, where the historical flow is weak and mixed.
The underlying data are daily from 1980: rates and curve slopes, credit conditions, inflation, labor, activity, profits, money, the dollar, commodities and volatility. Trending indicators such as CPI, payrolls and M2 are converted to year-over-year log changes. Each series is z-scored against a rolling five-year window, so every reading is relative to recent conditions, and capped at ±4 to reduce outlier effect. Some series with incomplete history use proxy data from nearest neighbors, which is down-weighted in the PCA.