Energy Signatures
Energy signatures are plots of a building's energy use against outdoor temperature. The slopes of the fitted line summarizes how the building responds to cold and heat, as well as the always-present base load. This is a study of 16 buildings with hourly data collected from energy monitors, spanning from 2014 to 2020.
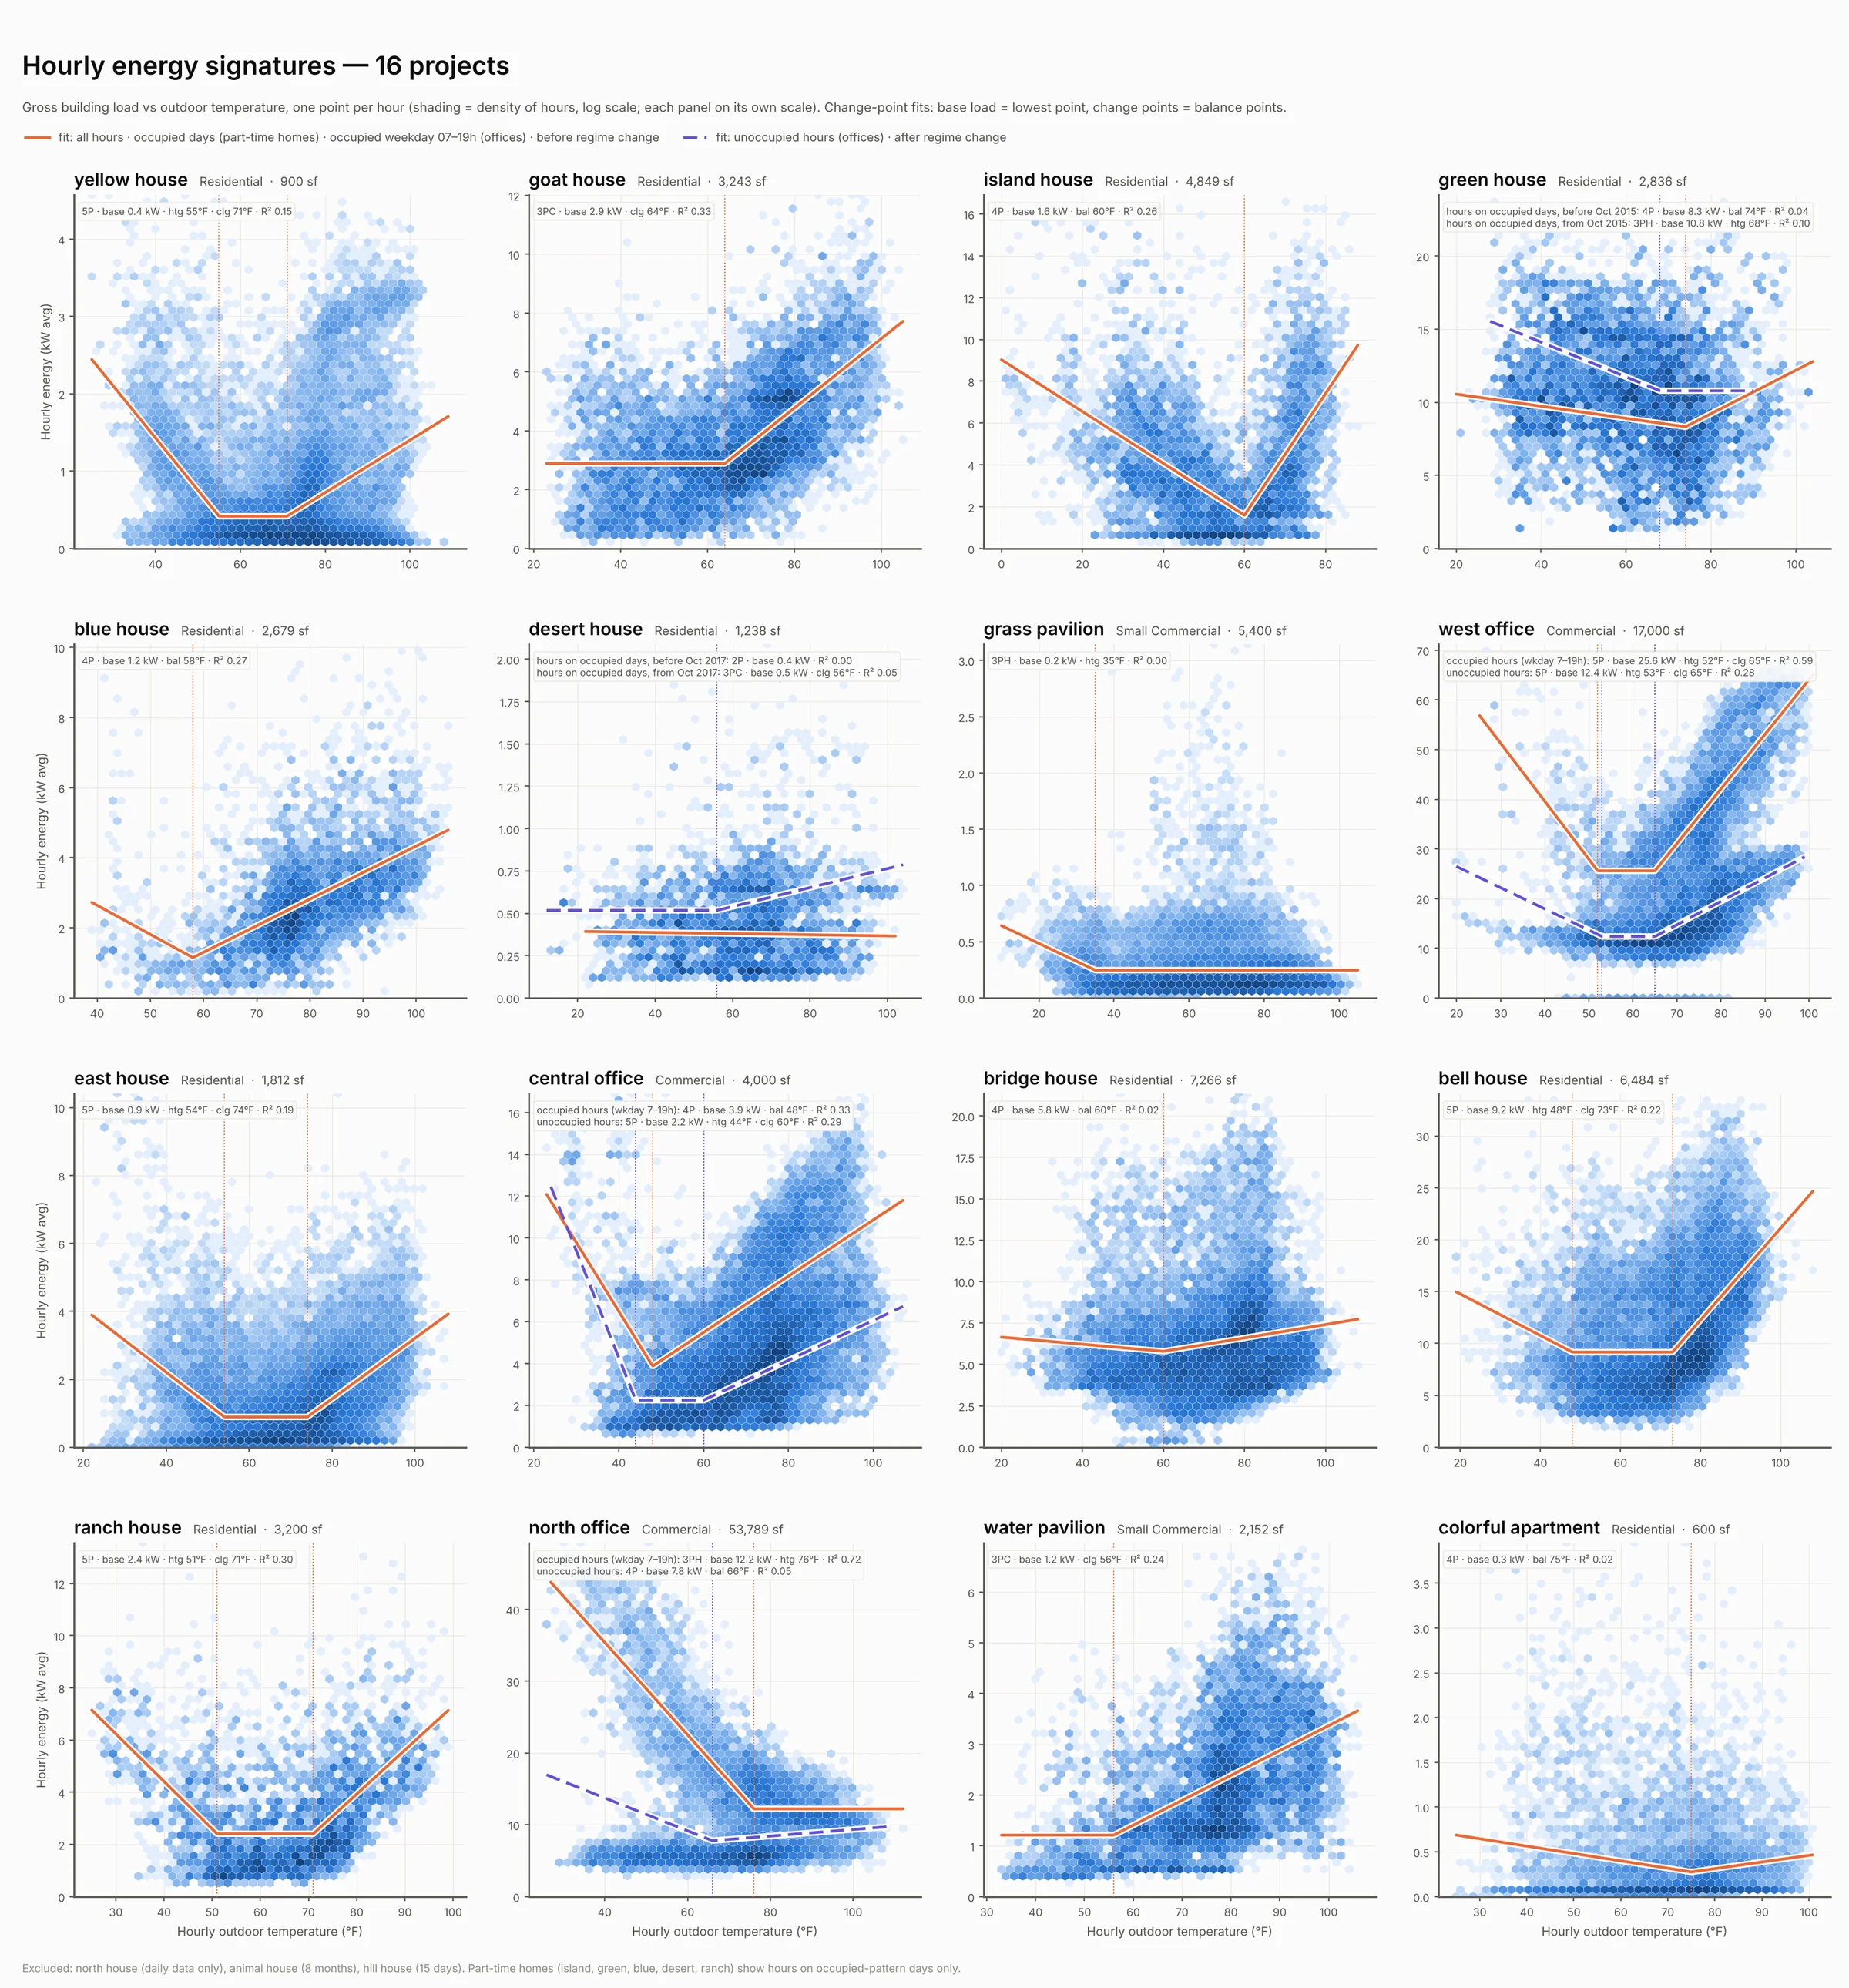
The majority of these buildings are recent constructions in Texas, with a few older buildings mixed in. Maybe because of that demographic, the majority of electricity use (median 77%) doesn't depend on the weather at all. That's the base load, represented by the flat area below the curve: appliances, lighting, always-on HVAC fans and everything else that runs regardless of temperature.
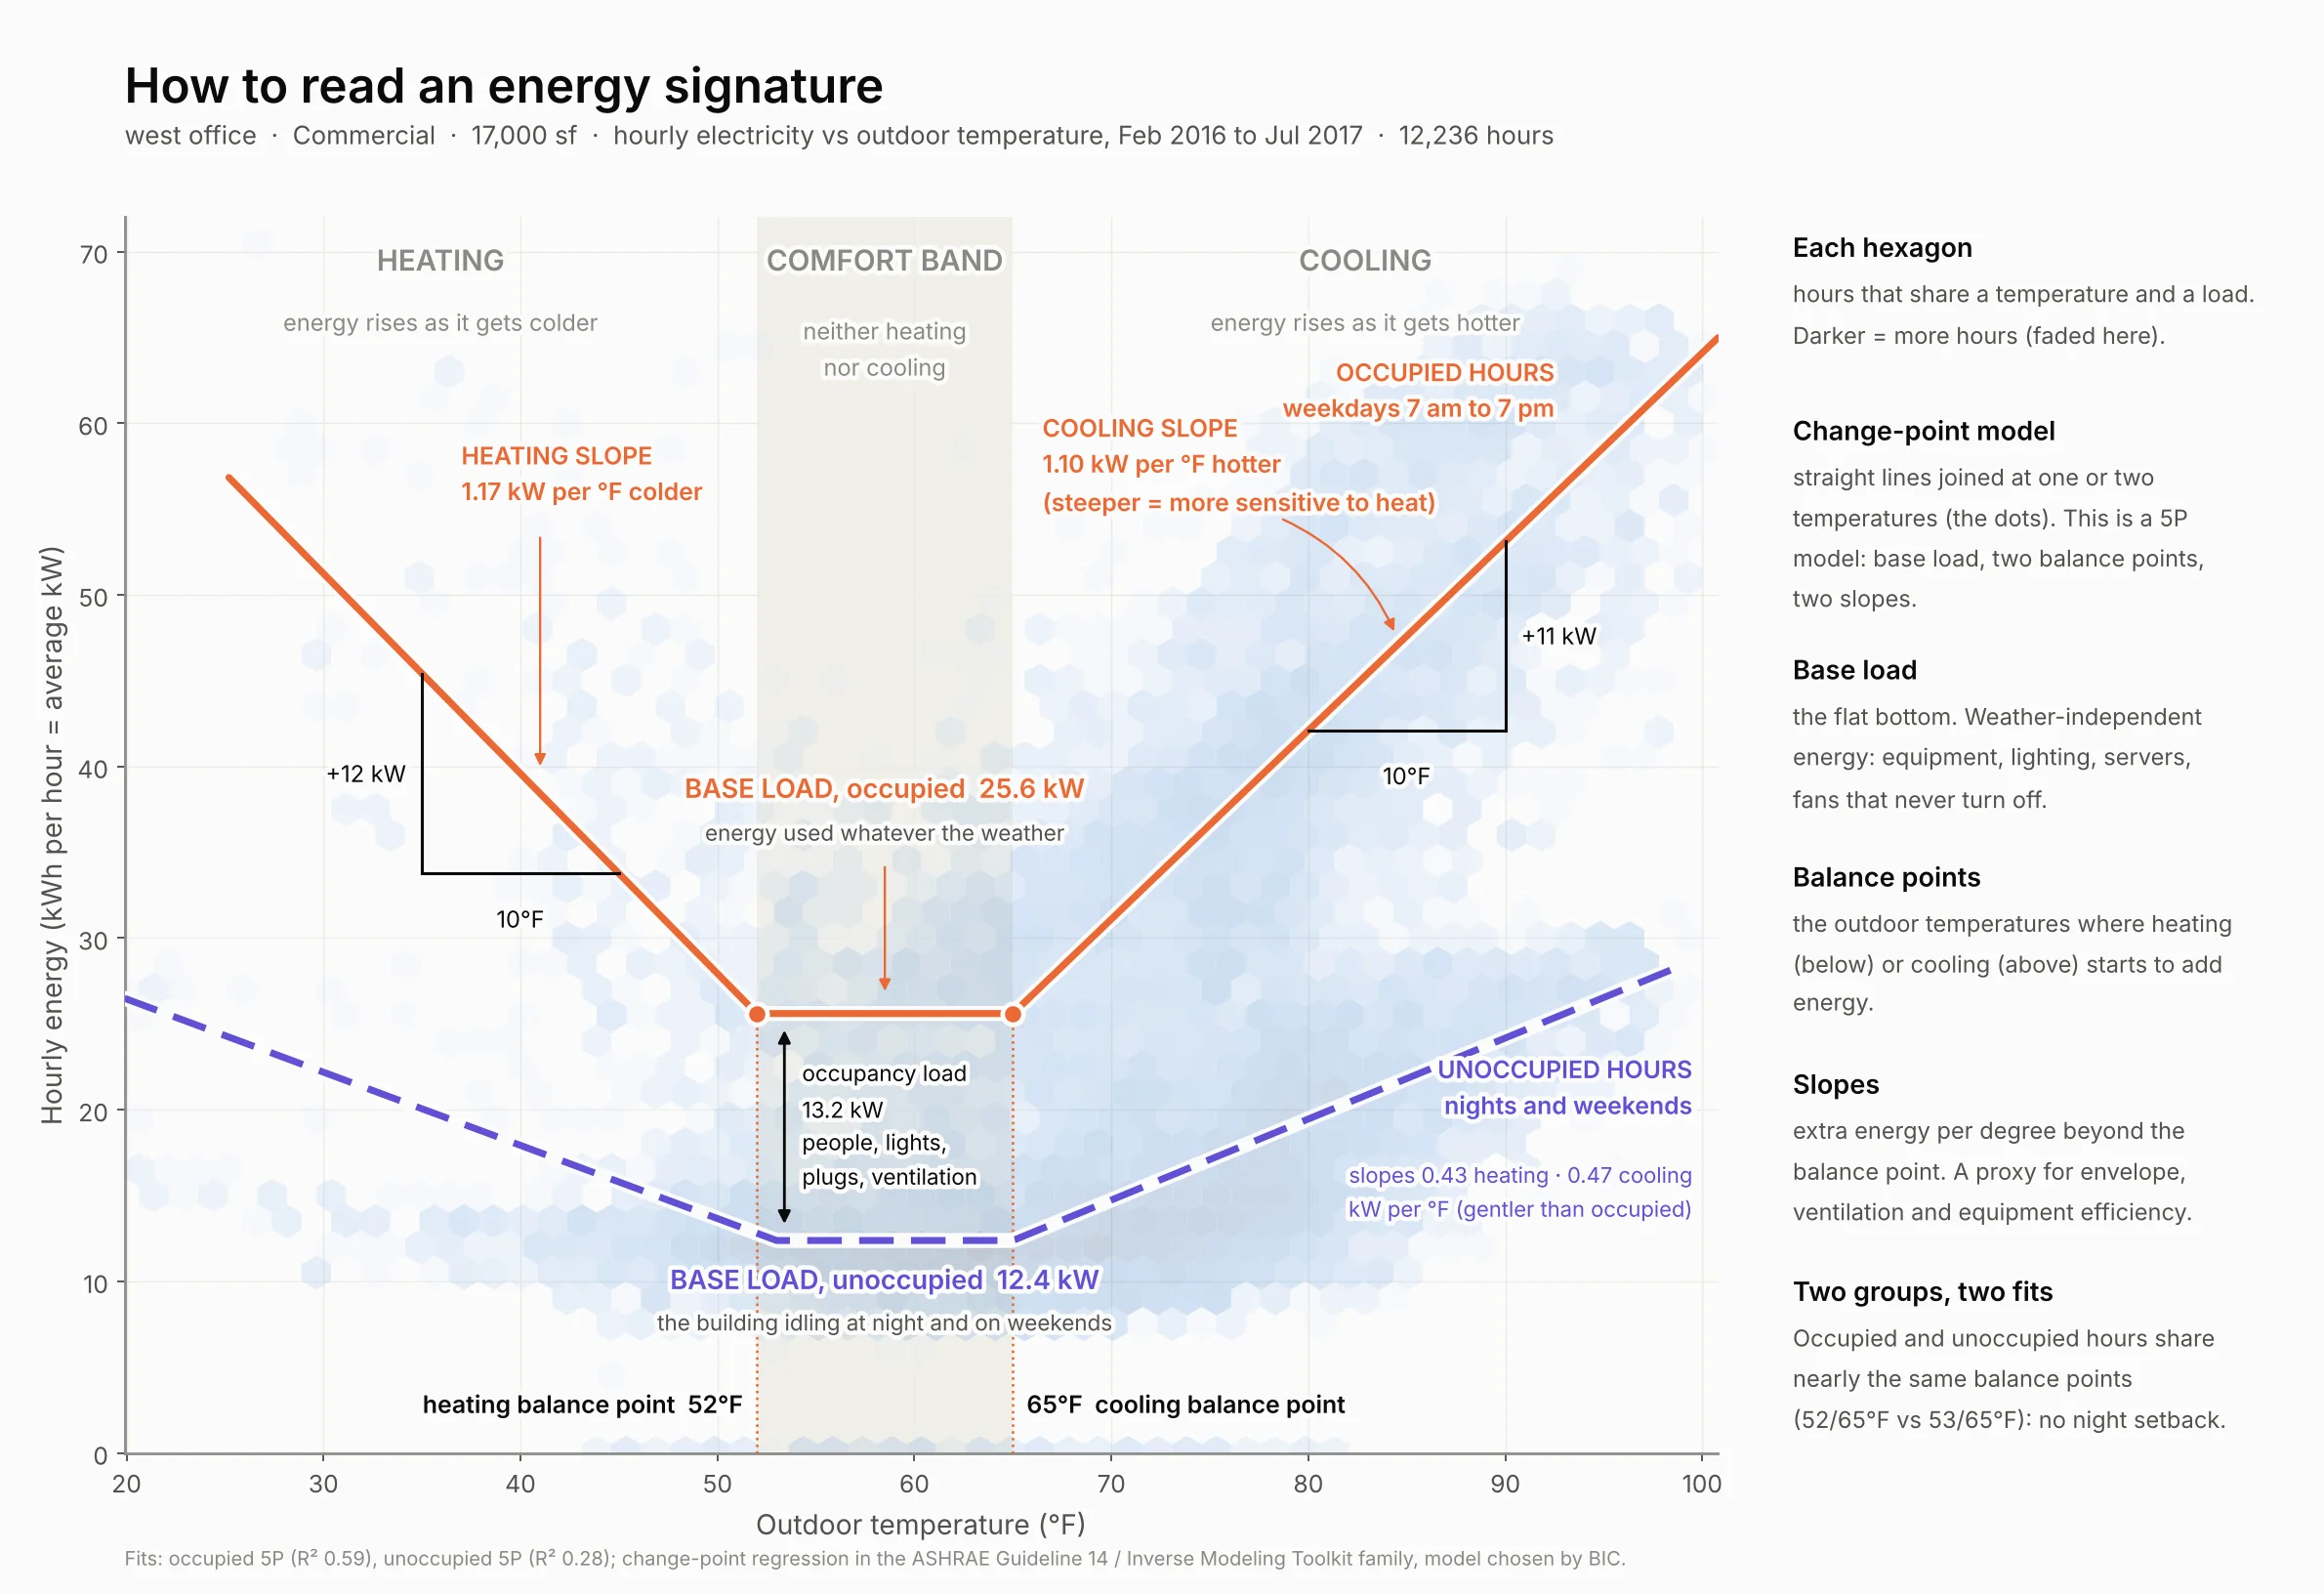
A change-point model is a set of straight lines joined at one or two temperatures.
- Base load: the flat, lowest part of the curve. This is the energy the building uses regardless of temperature.
- Heating balance point: the outdoor temperature below which energy starts rising because of heating.
- Cooling balance point: the temperature above which energy rises because of cooling.
- Slopes: how much more energy each degree colder or hotter costs, in kWh per hour per °F on the hourly plots.
Process.
- Most of these come from SiteSage eMonitors that log hourly data, circuit by circuit. These plots are built from total energy and recorded outdoor temperature.
- The curve was fit with the lowest BIC (Bayesian Information Criterion, a score that rewards a good fit but penalizes extra parameters). Each heating or cooling arm is required to have at least 15 points behind it to avoid outliers from small samples.
- Time is split between occupied and vacant hours, using the lighting, plug and appliance circuits. There are several examples of non-regularly occupied buildings in this dataset.
Offices
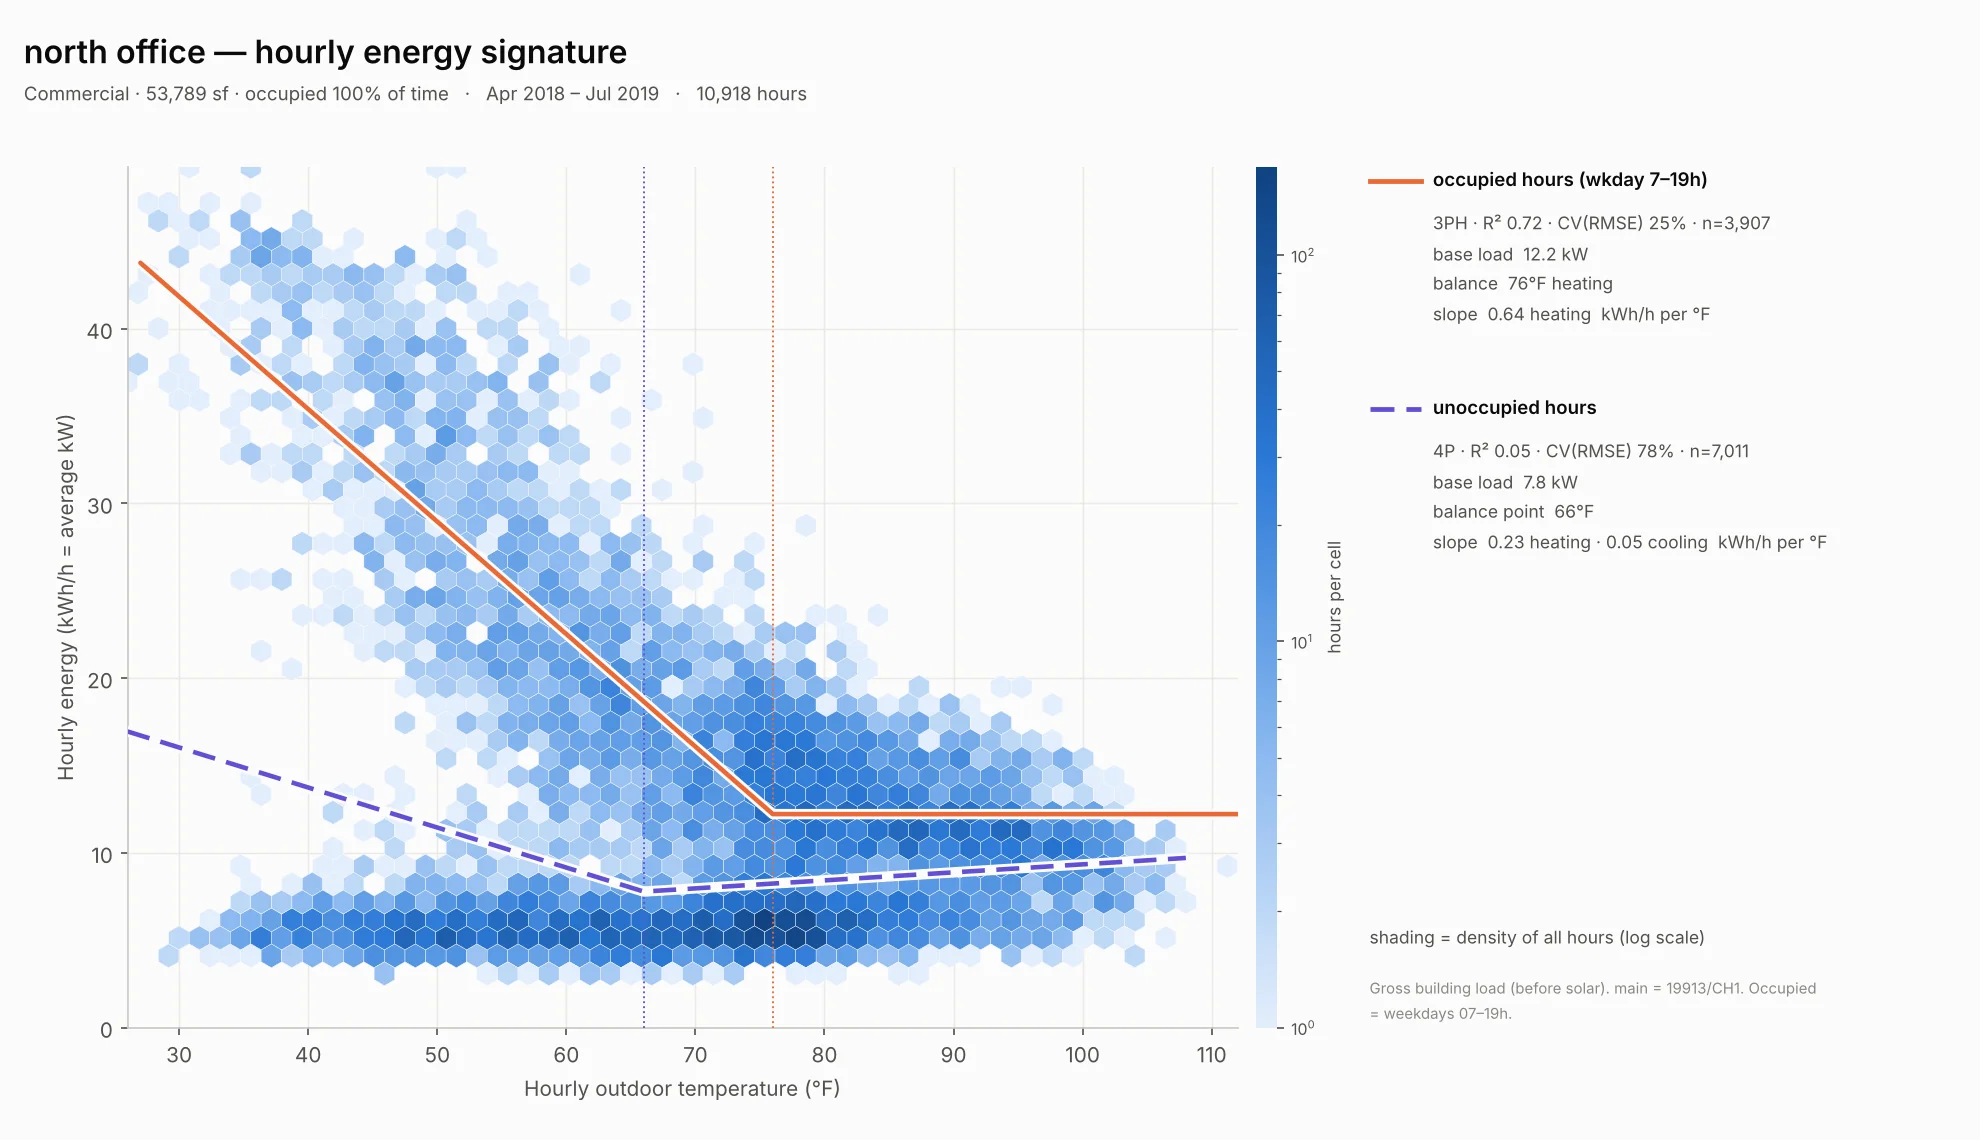
An office with no cooling load. This 53,000 square foot office has no cooling data from the eMonitor. Cooling runs from a separate central plant. On weekdays its energy climbs by about 11 kWh a day for every degree below 72°F, and it stays flat above that. The electric heating is recorded by the eMonitor, making this an incomplete, asymmetrical signature.
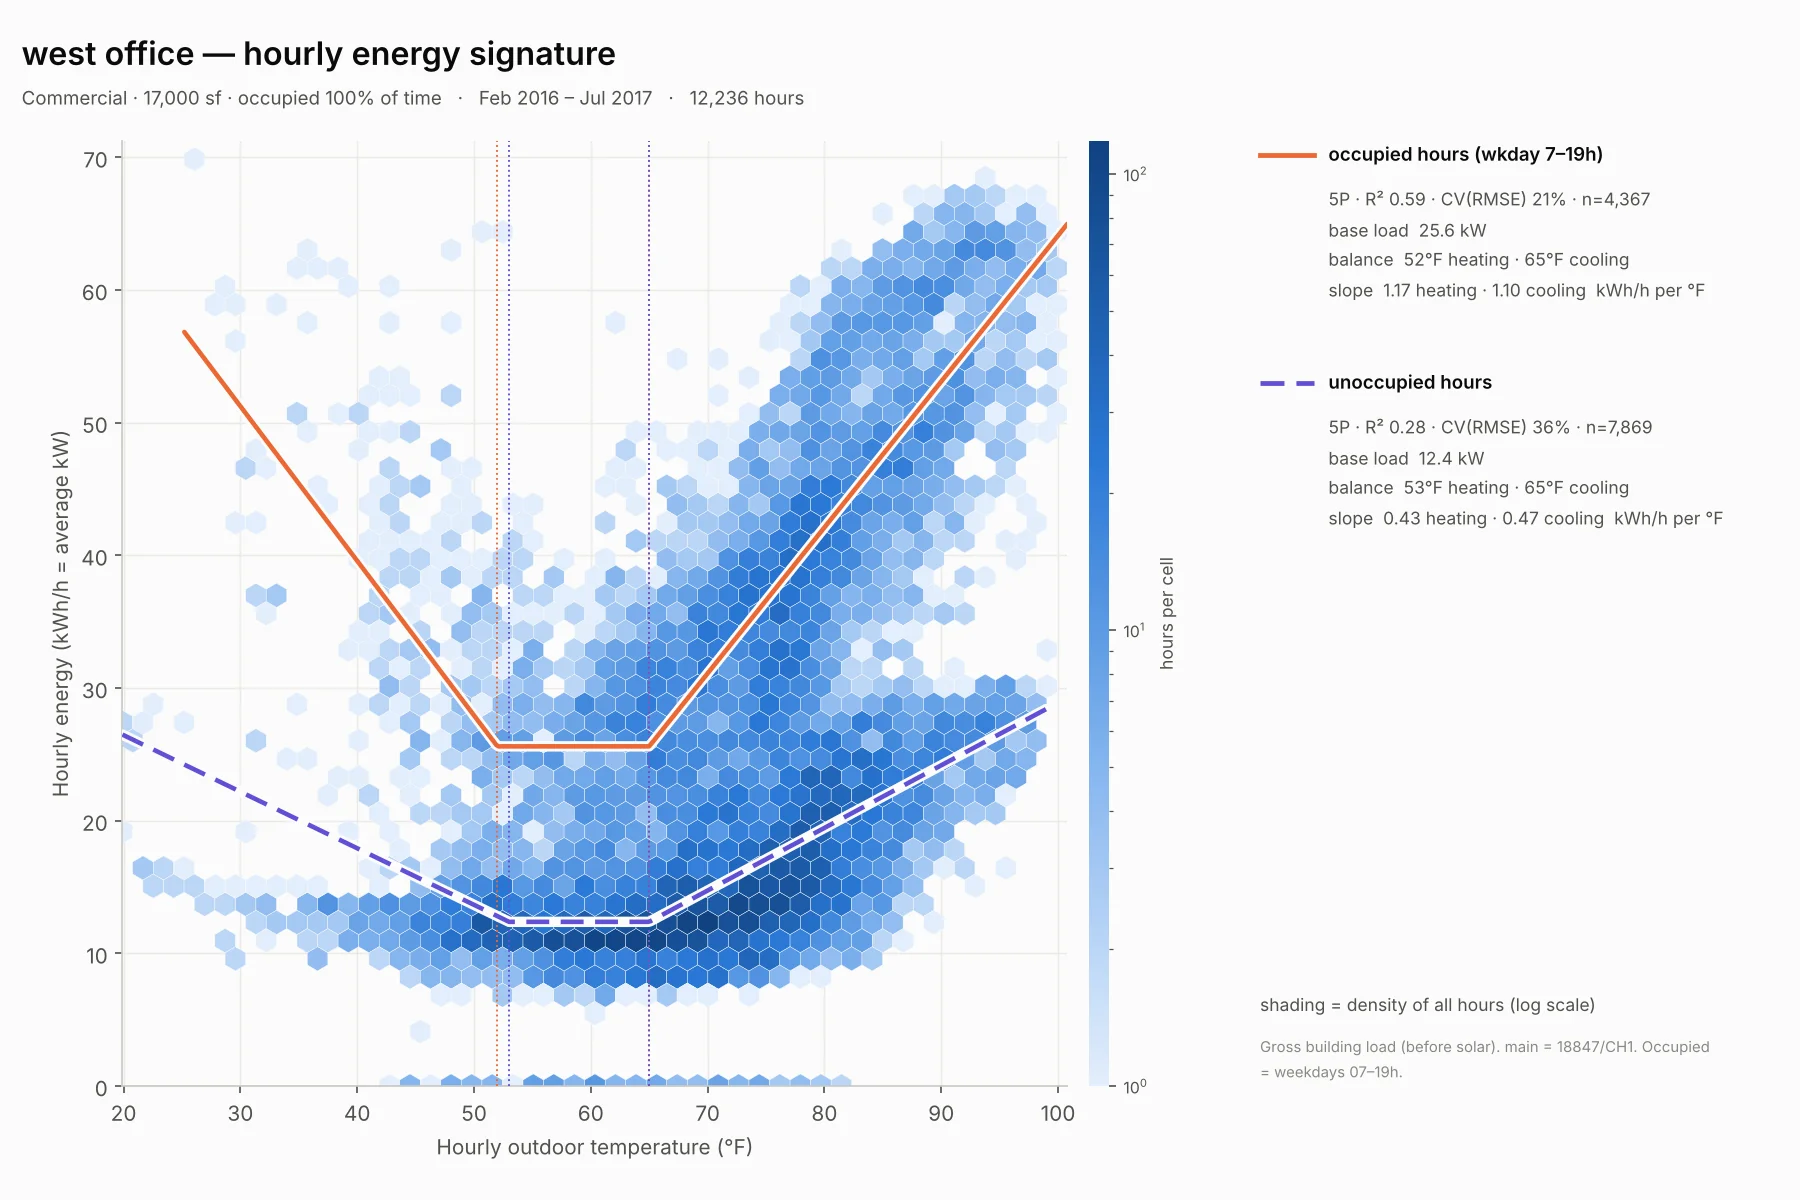
The textbook office. This 17,000 square foot office forms two nested V shapes, one for occupied hours and one for nights and weekends. It has the lowest daily variation in the set: R² of 0.80. They run it like a Wendy's. The empty building base load sits at 12 kW, half its occupied base of 26 kW.
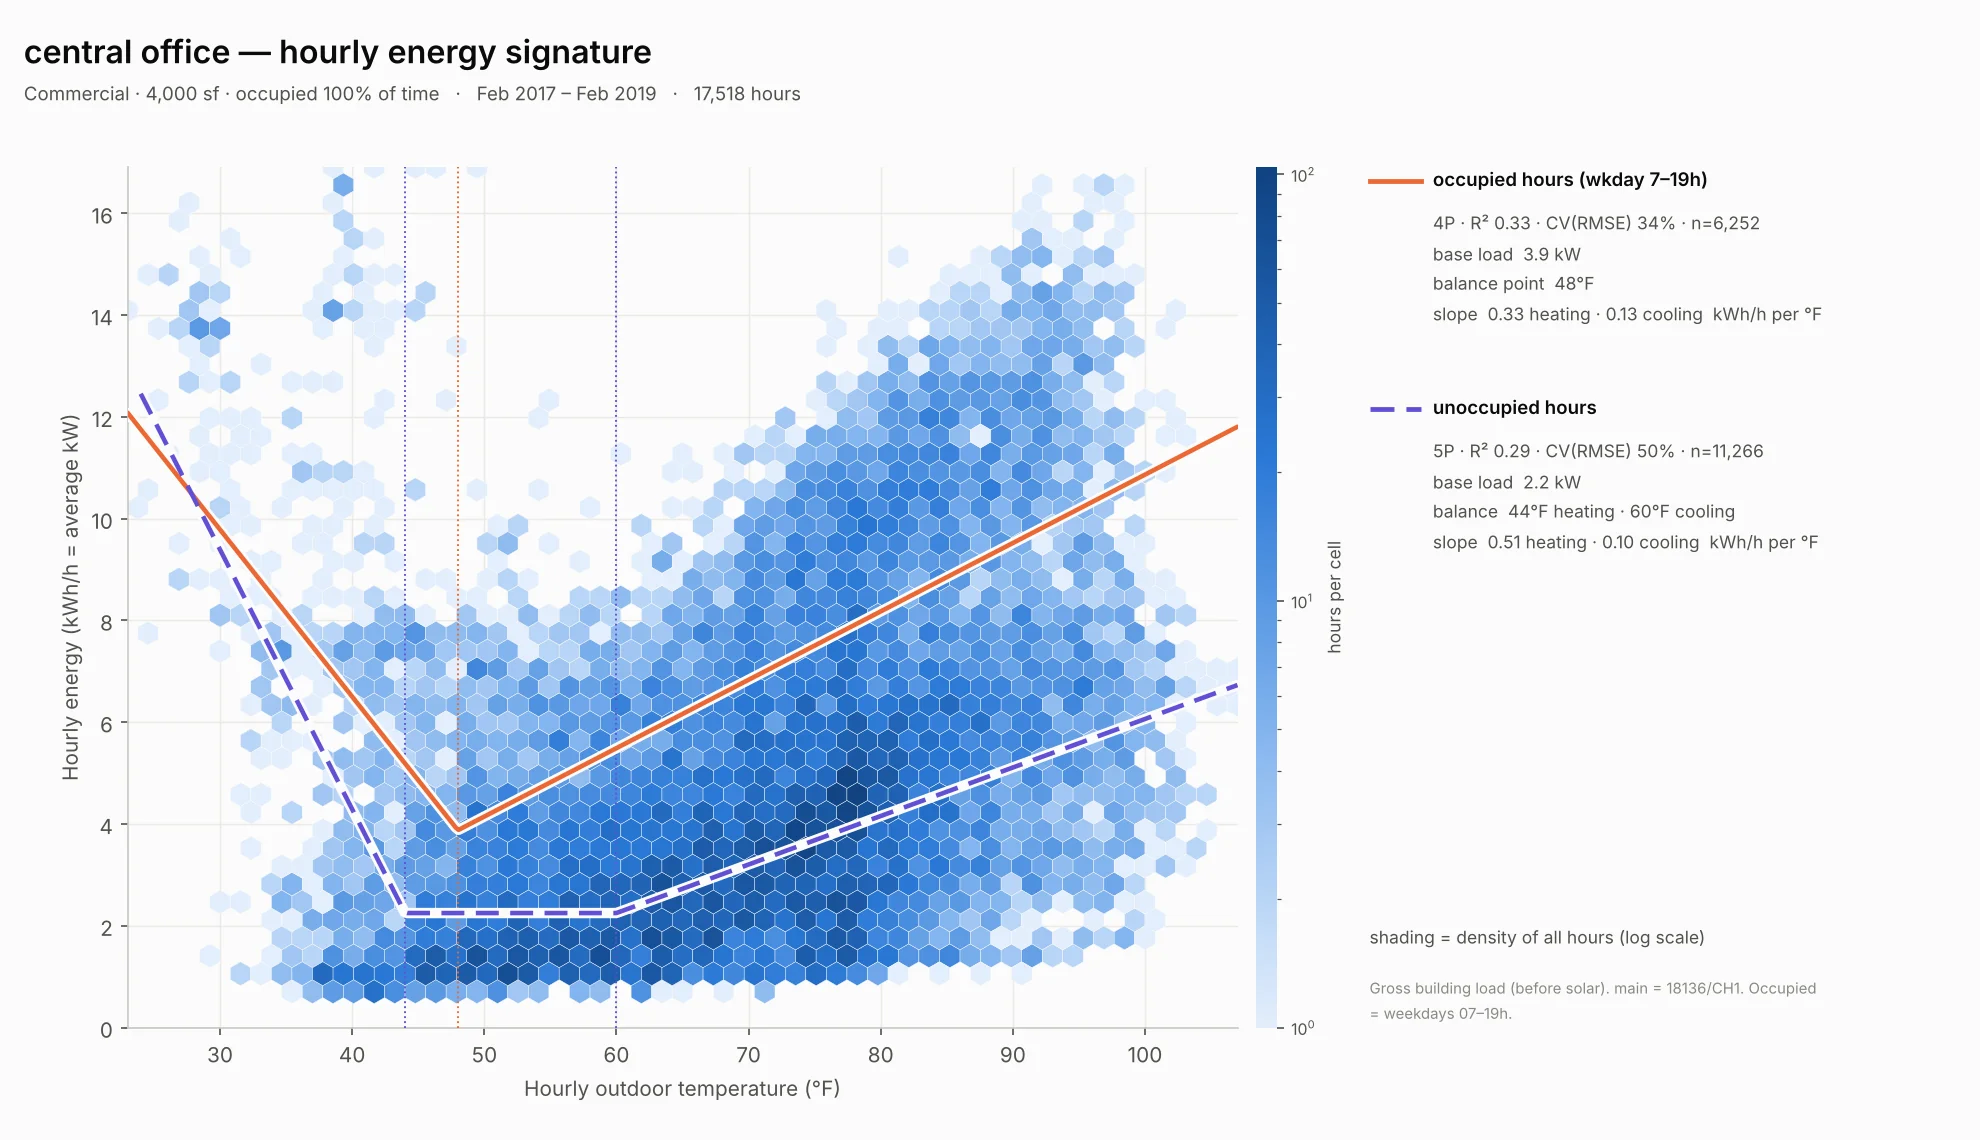
A steep heating slope. This is a 4,000 square foot office space in a much older building. It's mostly cooling dominated, but the heating slope is very steep when it drops below 40 degrees. The heating slope during unoccupied hours (0.51 kWh per hour per °F) is higher than during occupied hours (0.33). There's no setback, and without people and daytime sun to help, the heating works harder overnight.
Occupant habits have the biggest impact on energy. Substantial base loads tell us that it's occupant behavior that drives energy use. This includes day-to-day decisions like setting set-points, but it largely comes from early decisions in the design process, like lighting power density, sizing appliances, and unavoidable program requirements. This finding is even more pronounced with a well designed building envelope and efficient HVAC.
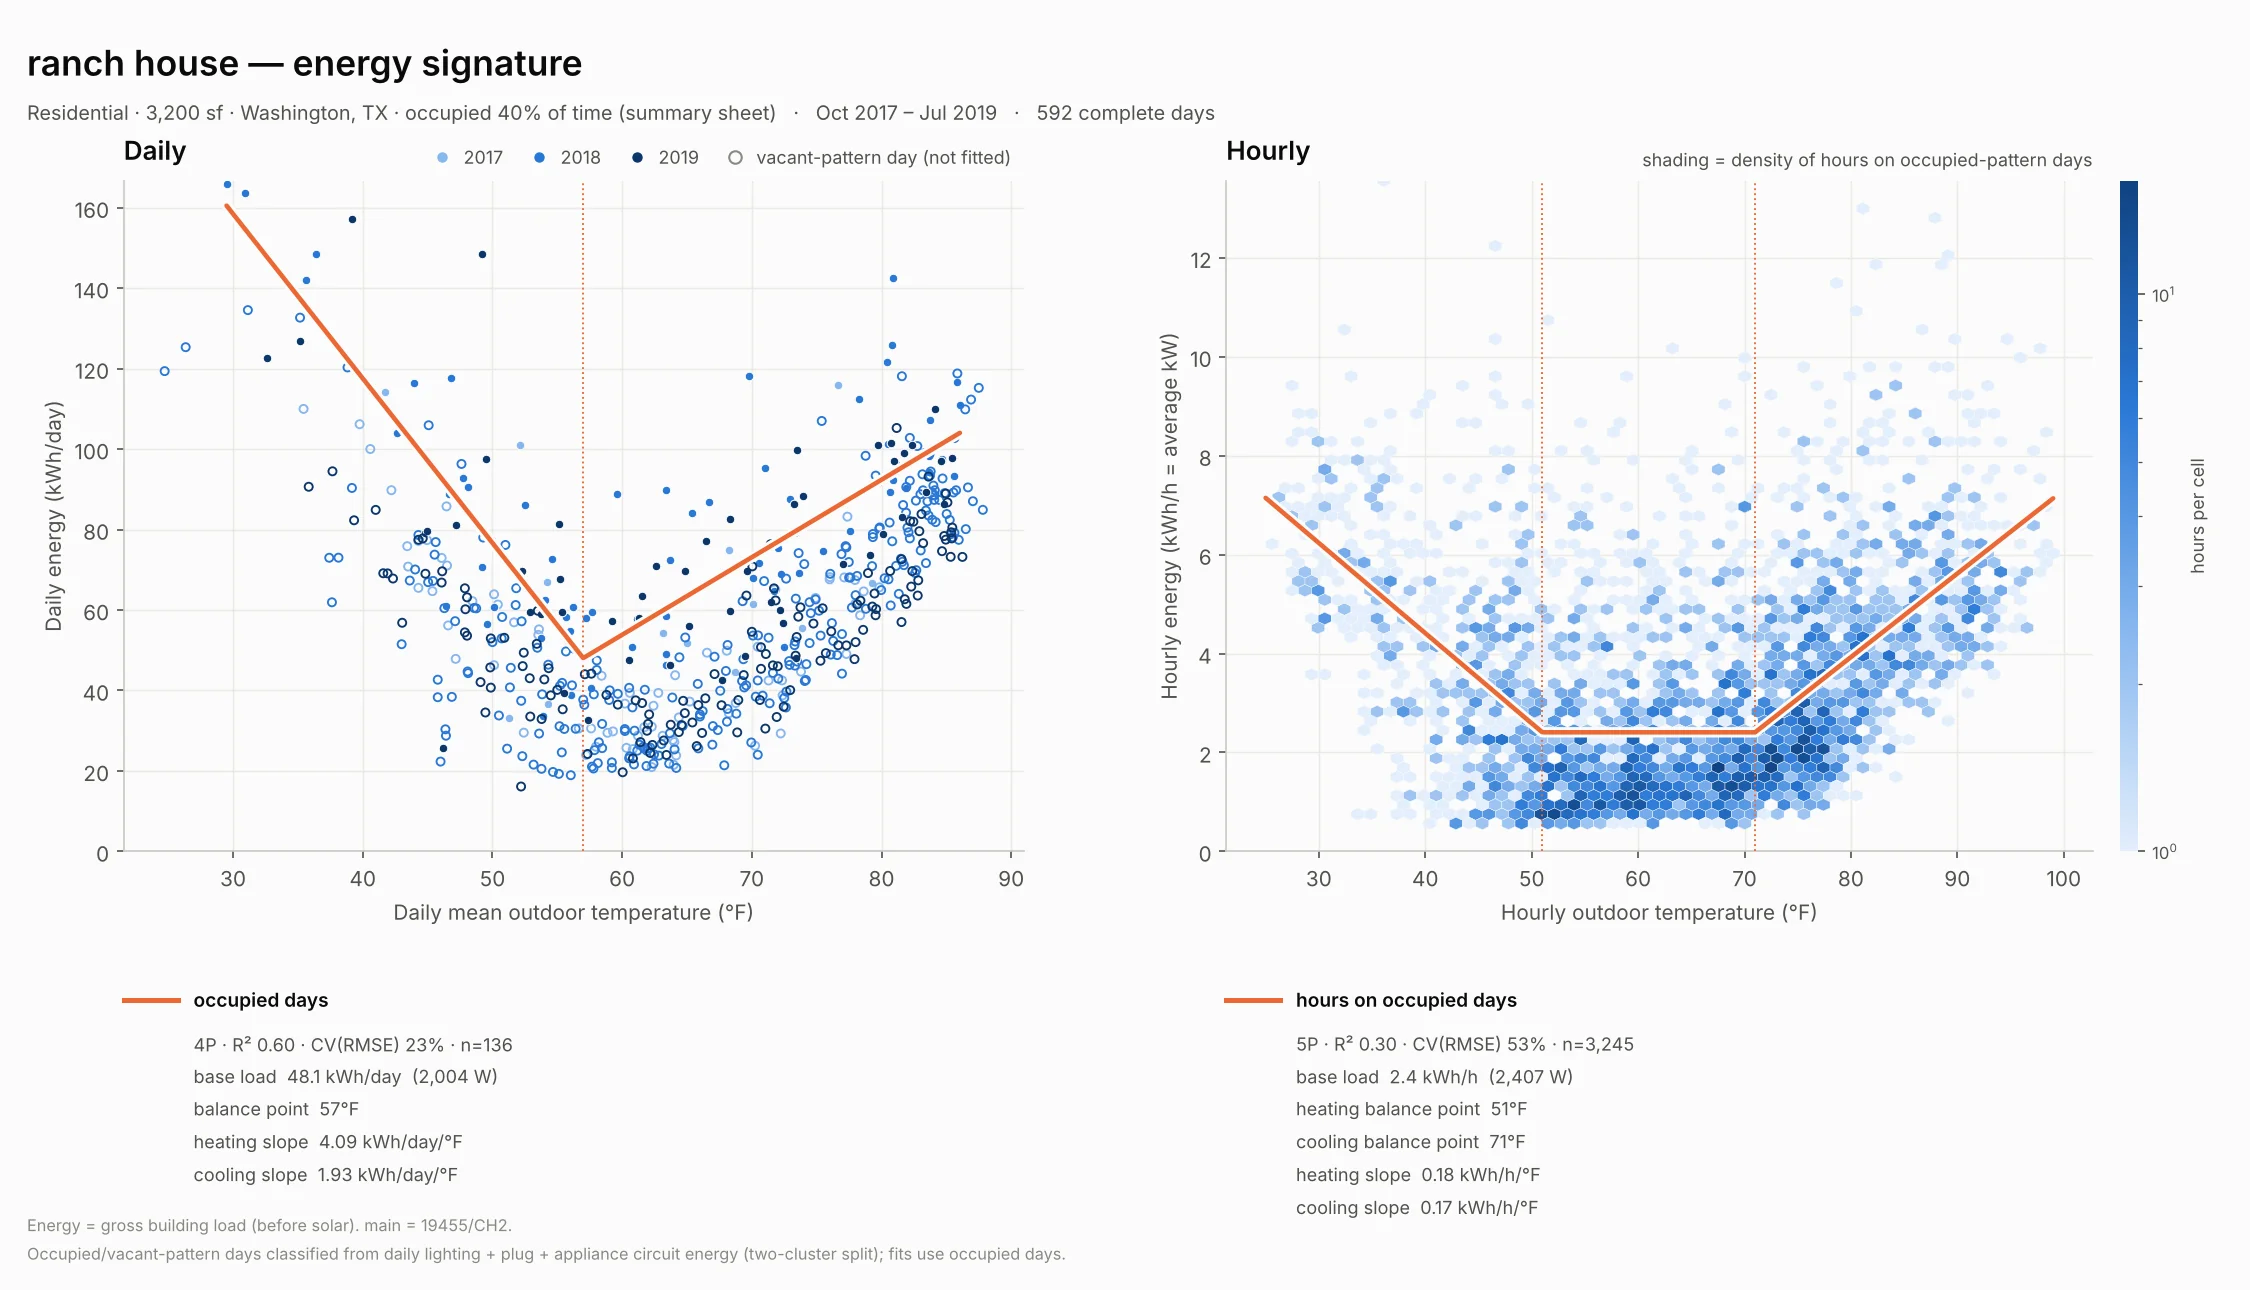
Daily vs Hourly Resolution. A day that averages 60°F can contain a heating morning and a cooling afternoon. Daily averaging obscures the finer detail visible in an hourly plot. For this part-time house in south Texas, the daily fit (left) shows one balance point at 57°F. The hourly fit (right) shows a real band from 51°F to 71°F, where the house neither heats nor cools.
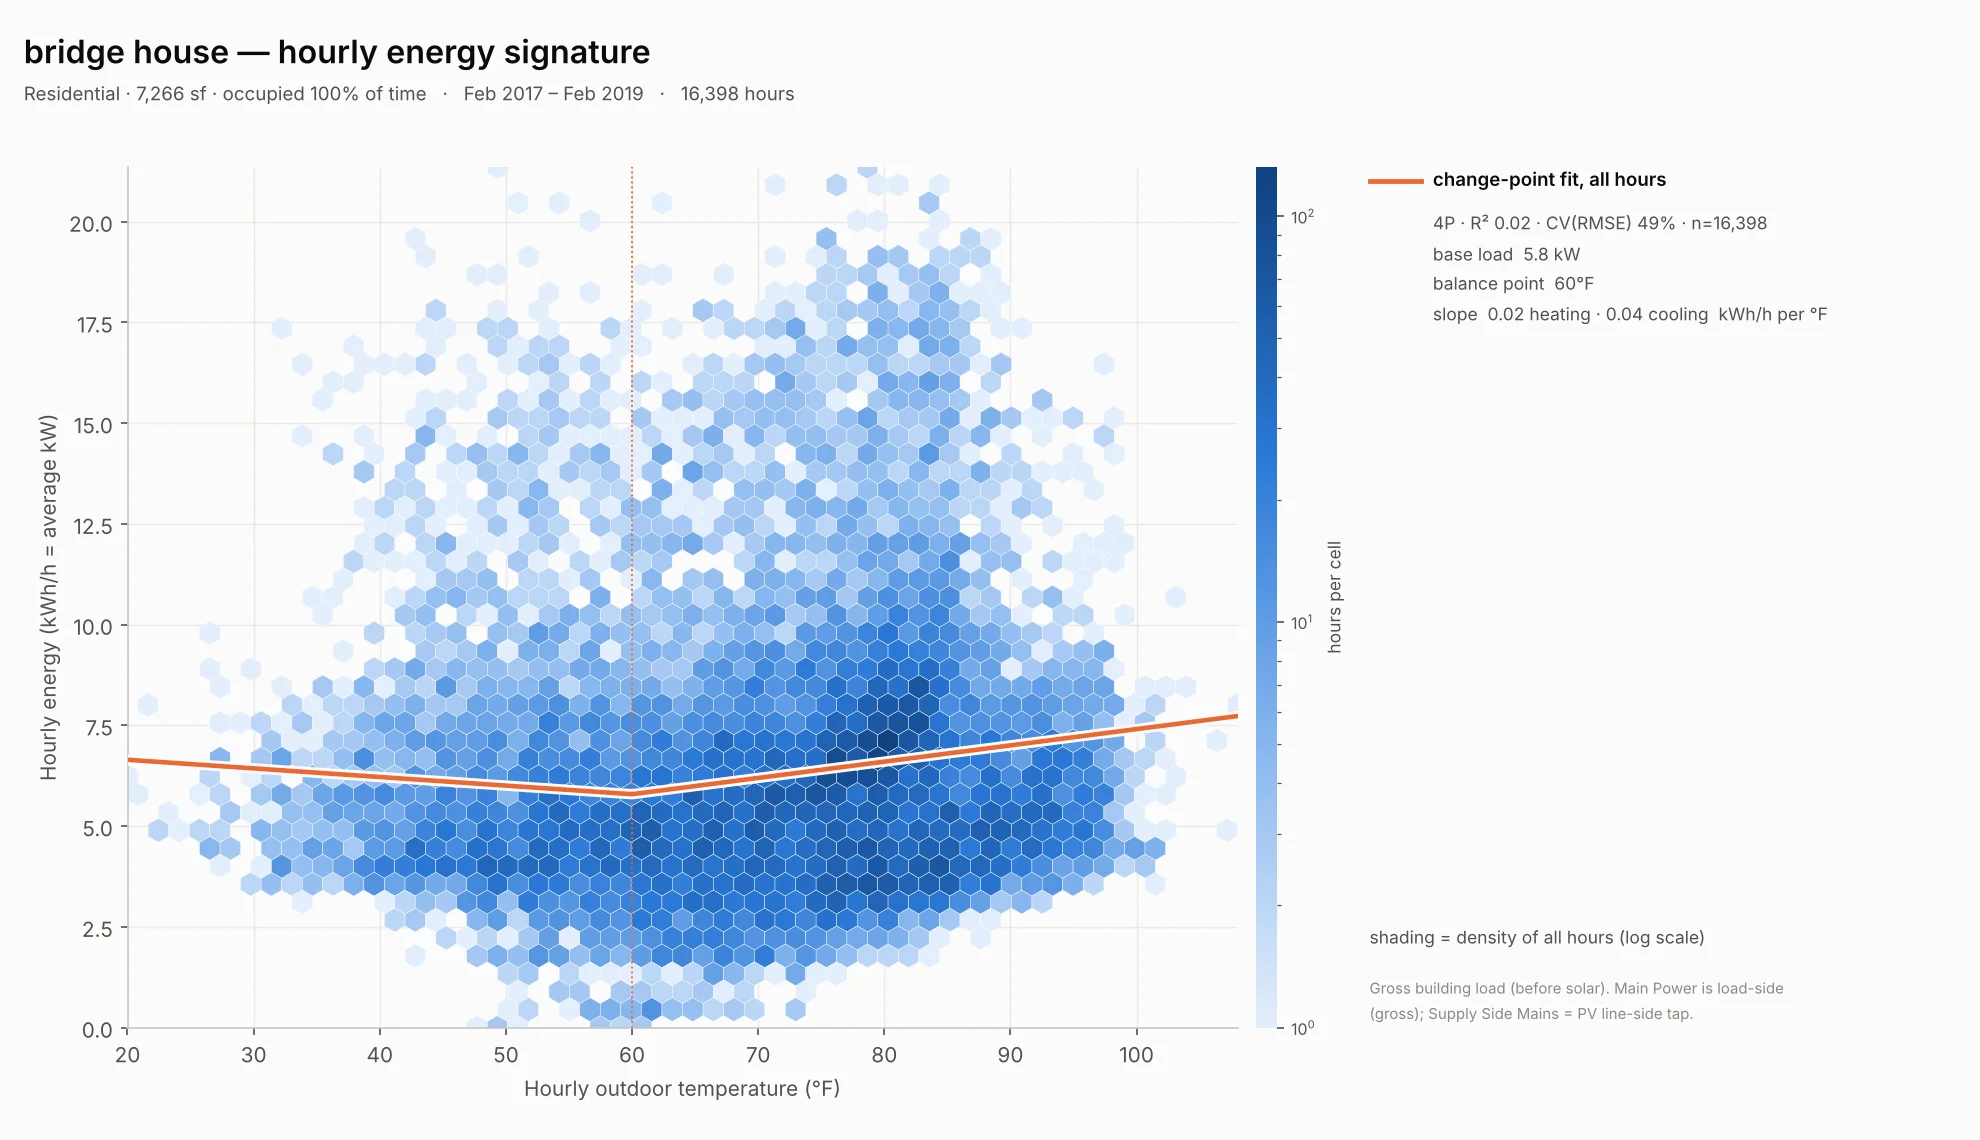
Geothermal shows up as the flattest home. This 7,000 square foot house in south Texas has the gentlest slopes of any home per square foot. Per 1,000 square feet, they're 0.17 (heating) and 0.24 (cooling) kWh a day per °F. Its HVAC is two geothermal heat pumps, which exchange heat with the ground instead of the outdoor air. Its hourly R² is 0.015, meaning temperature explains almost none of its hour-to-hour load.
The smallest home is the most sensitive to temperature. The 1,000 square foot 'Yellow House' in central Texas has the steepest slopes per square foot of any residence. Per 1,000 square feet, heating and cooling each cost about 1.6 kWh a day per °F. Small homes have more outside wall and roof per square foot of floor, and this one has an older, leakier envelope.
All Buildings on One Scale
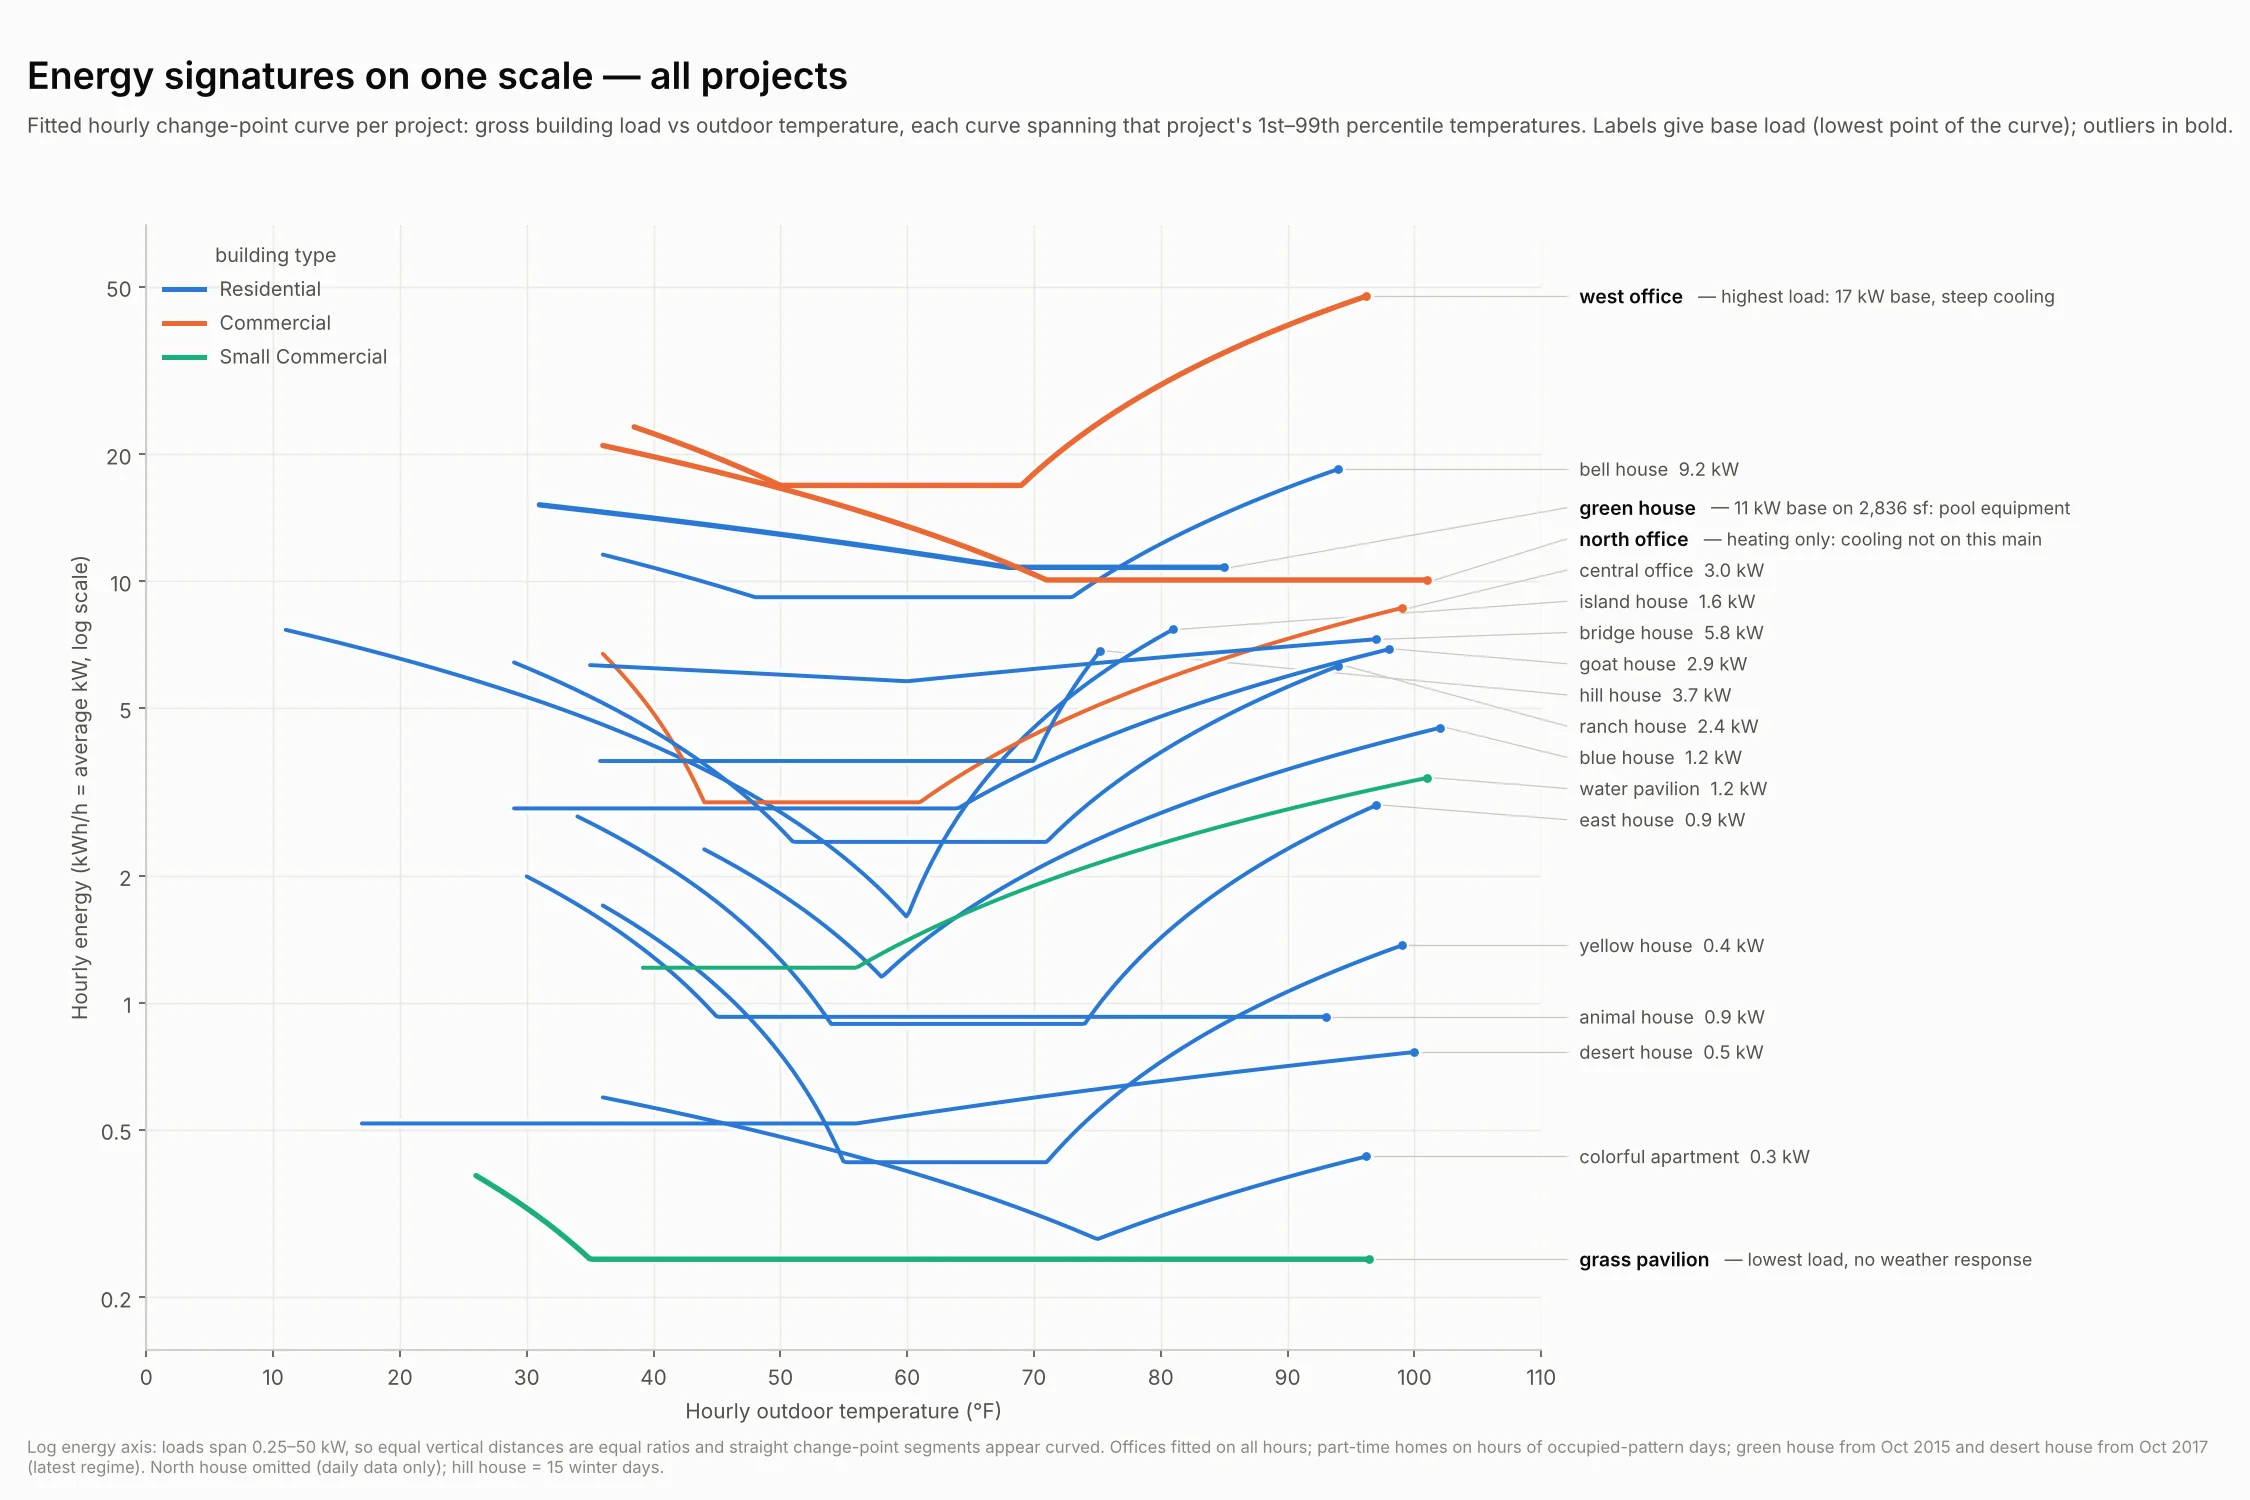
This is every building's energy signature on the same axes and scale, colored by building type. The energy axis is logarithmic to fit everything in frame.
The outliers are in bold:
- west office, with the highest load and the steepest cooling
- north office, with heating only
- green house, with an 11 kW base on 3,000 square feet (pool equipment)
- grass pavilion, an open-air pavilion, with the lowest load and no weather response. passive ventilation and no active cooling besides overhead fans.
Limitations
- These show electricity only. Homes with gas heat show only their furnace fan in winter, so their heating arms are understated. The signatures are only as complete as the eMonitor data. A lot of these have gaps.
- The occupied and vacant split is a guess based on light and plug use.
Have a look at 'Energy Calendars' to see the same data as radial calendars.