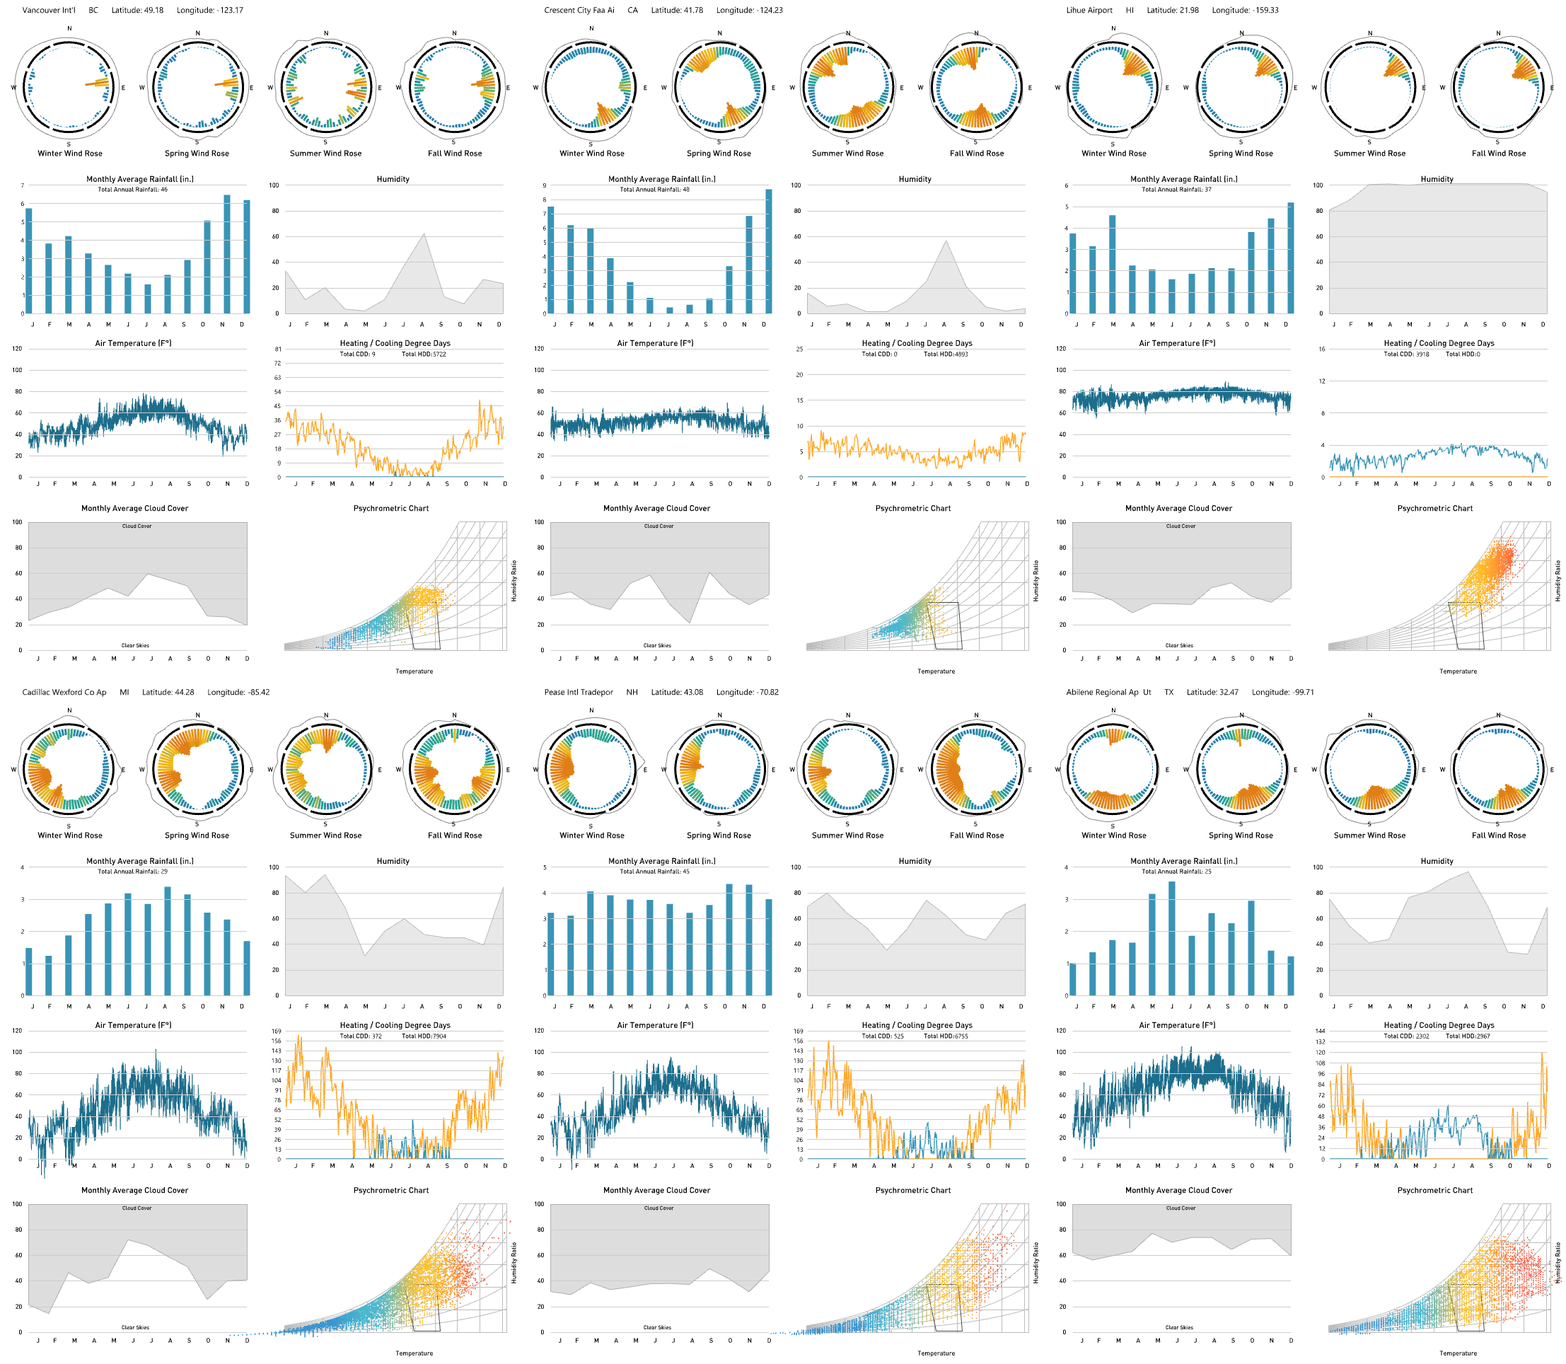
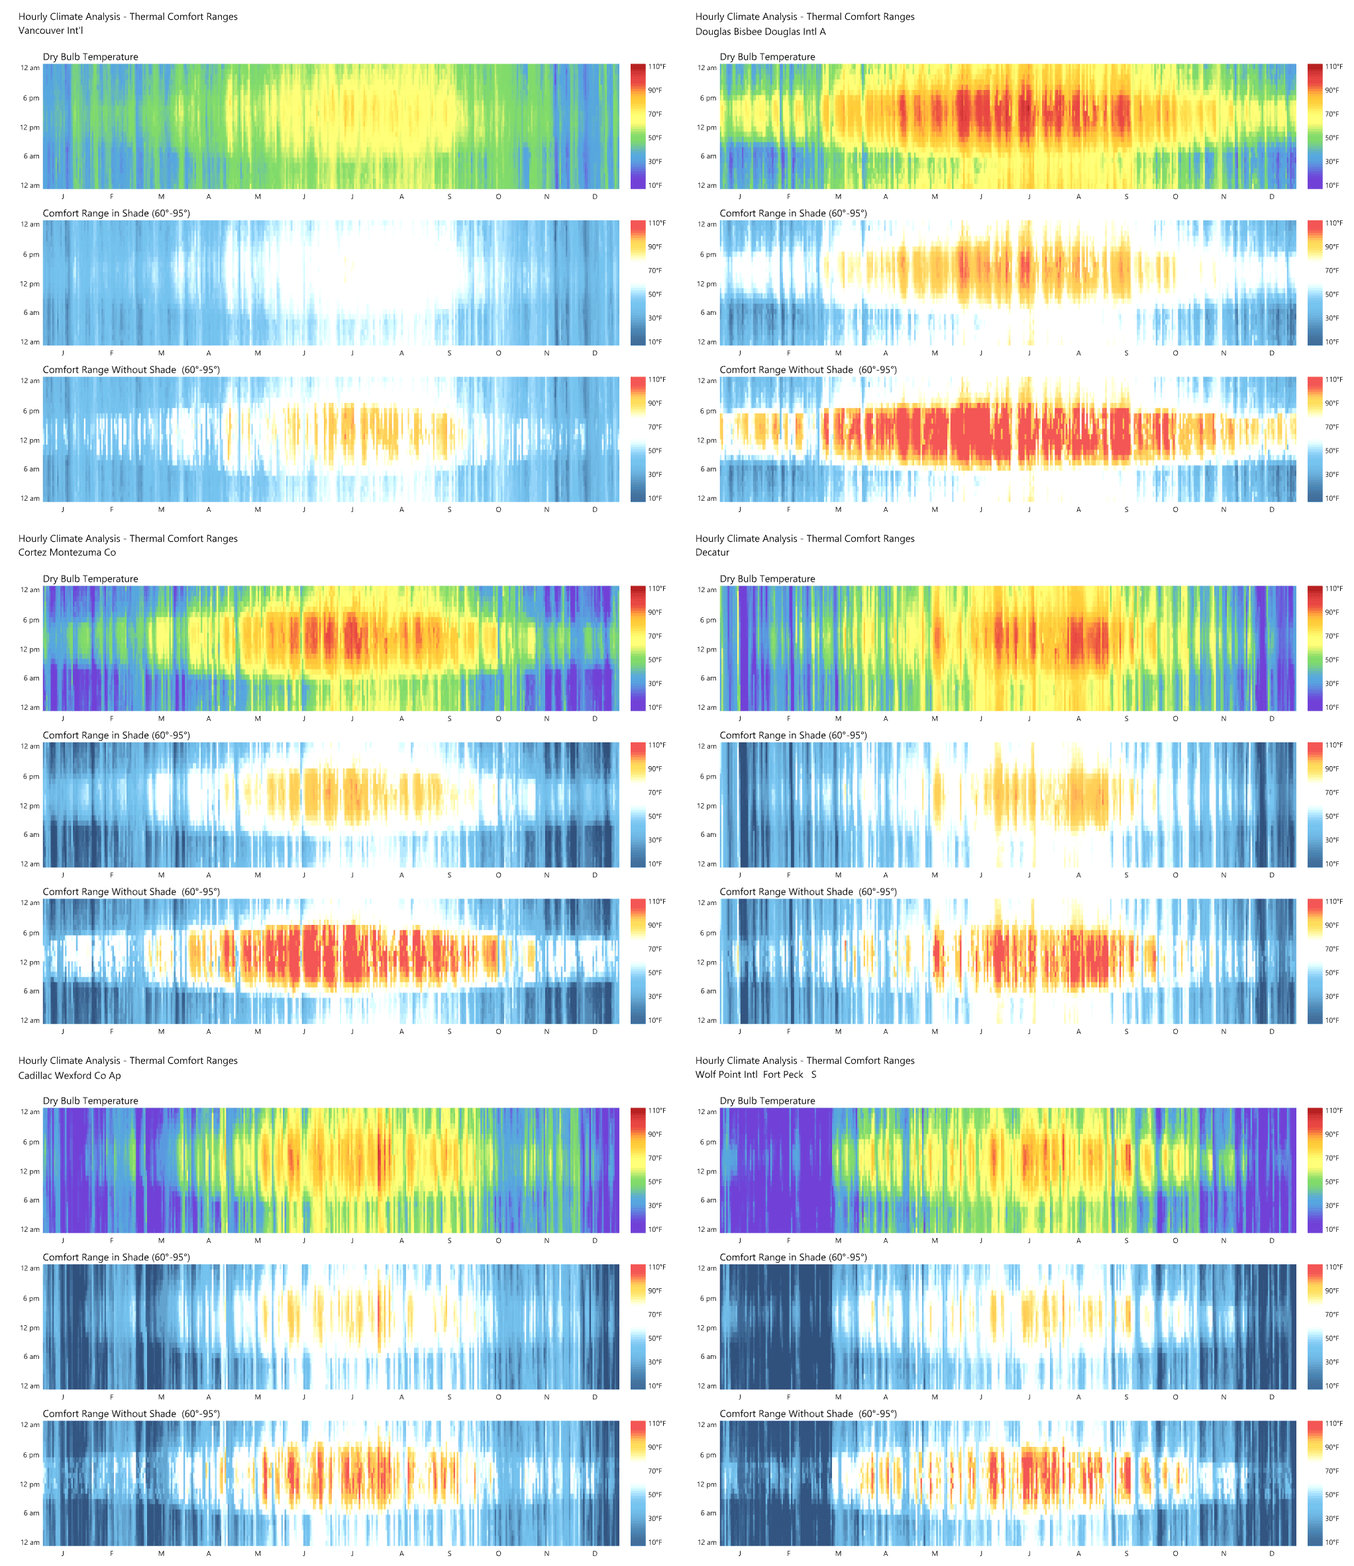
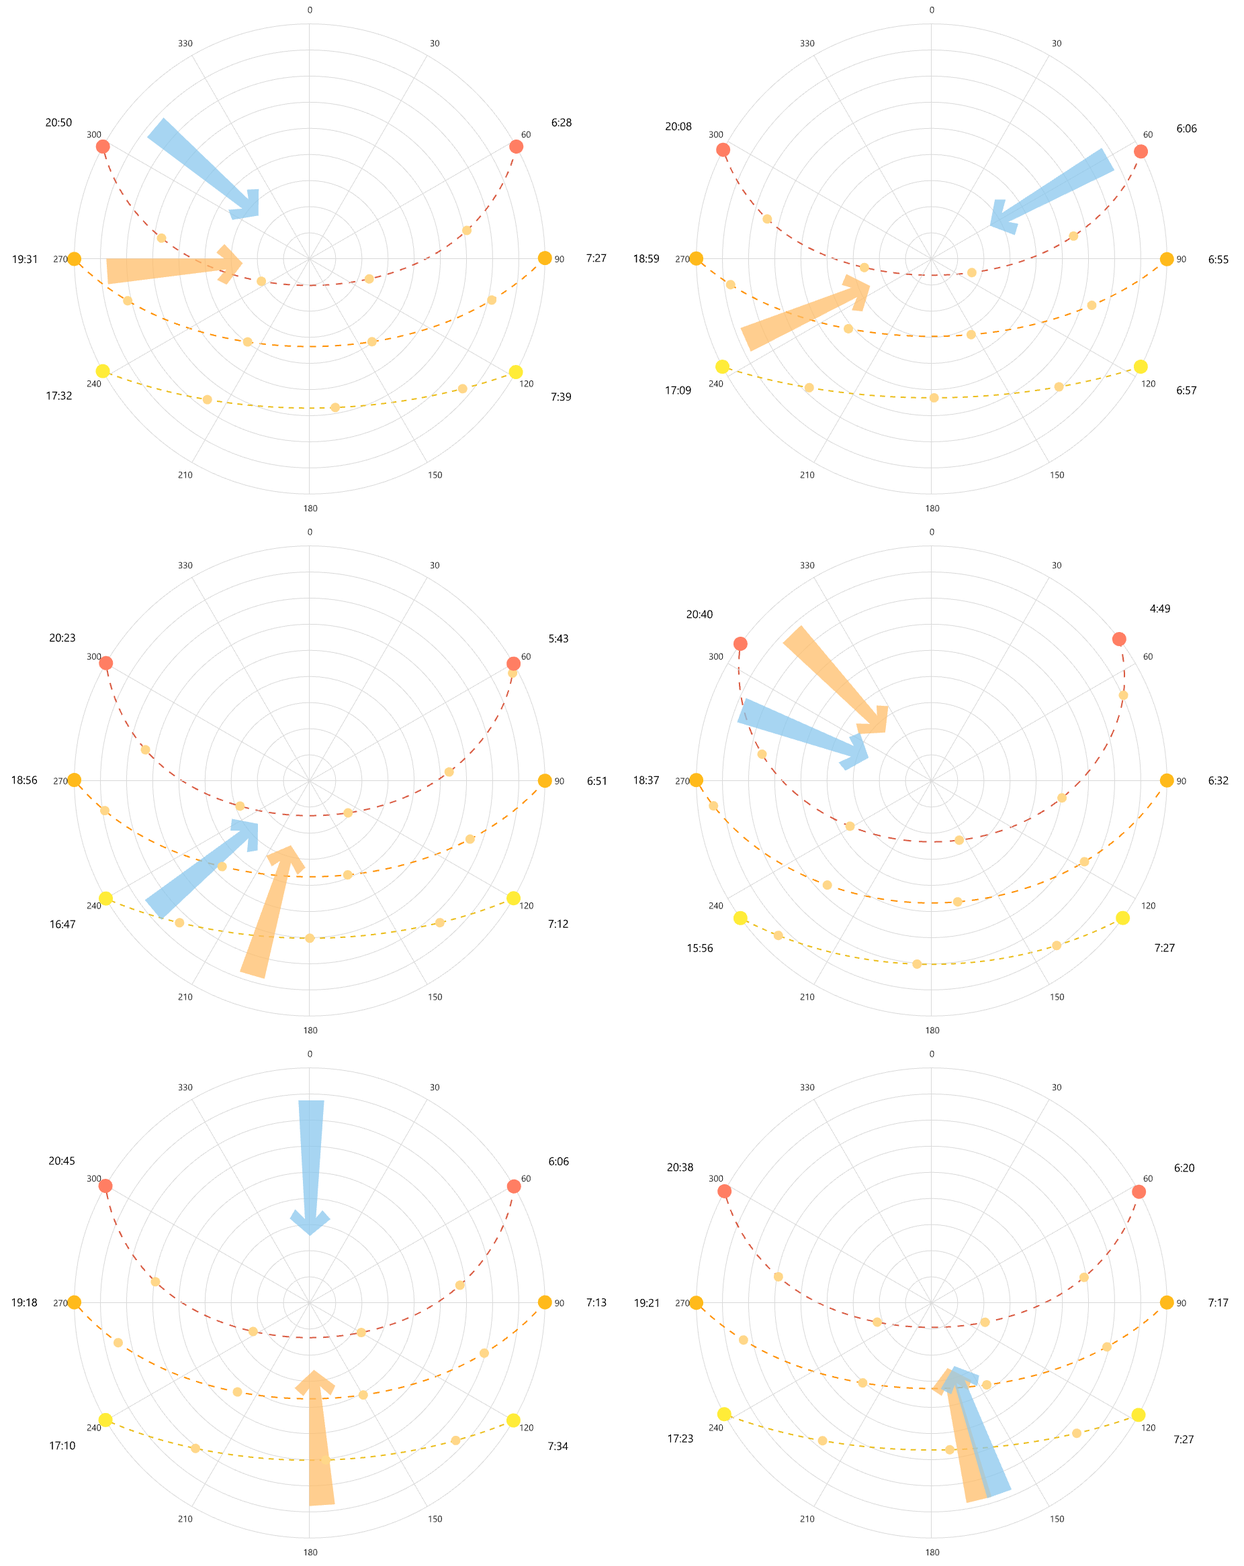
The automation of climate graphics is a great use case of parametric design. These graphs are the product of a collection of Grasshopper scripts that interpret a TMY3 weather file to produce a standard set of graphics.
Climate graphs, including wind roses, rainfall, humidity, heating/cooling degree days, temperature, cloud cover, and a psychometric chart.
Hourly thermal comfort graphs, which indicate the average temperature for every hour of the year, and whether or not each hour is above or below a given thermal comfort range.
Sun path and wind diagram, which indicates the position of the sun in the sky on key dates of the year, sunrise and sunset times, and the direction of the prevailing winds for each season.


