This is Part 2 of a series on my Biometric Mapping project. See the first post for an introduction.
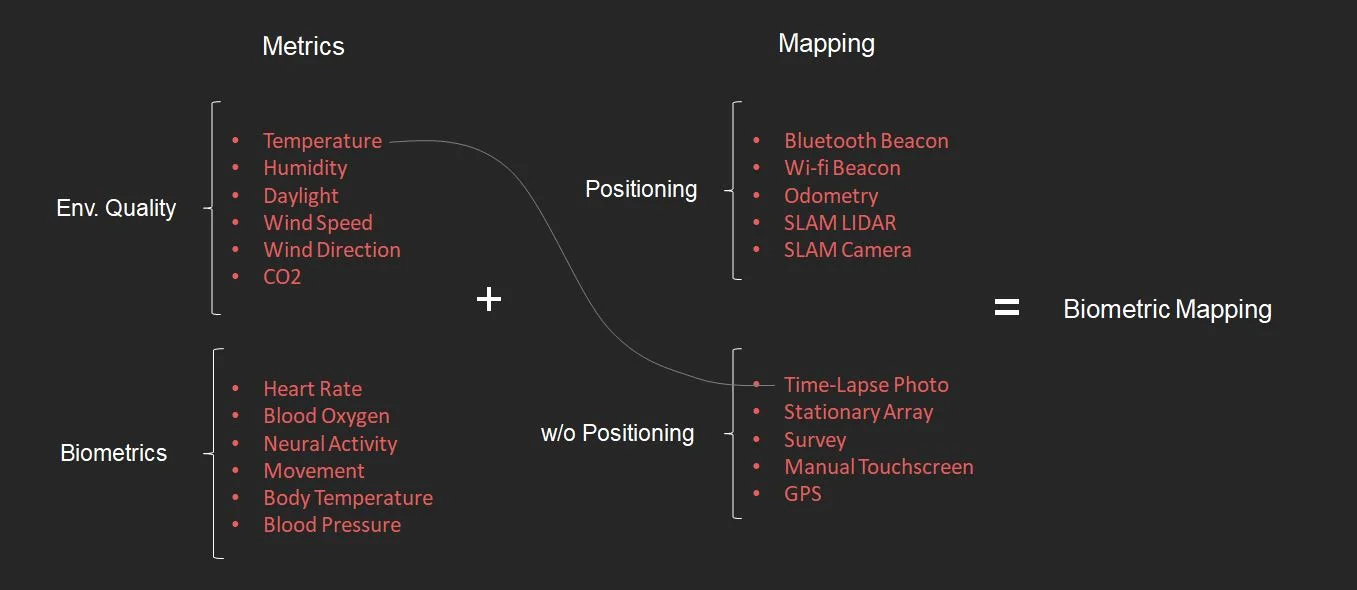
Biometric Mapping is about selecting one or more metrics, such as temperature, light, heart rate, or neural activity, and mapping it with some kind of positioning system. These can be mixed and matched to produce devices for mapping the unseen characteristics of different spaces. So far, I've adopted Arduino as the platform for collecting these metrics. Arduinos are single-board micro controllers that can host sensors and run software to record the data they collect.
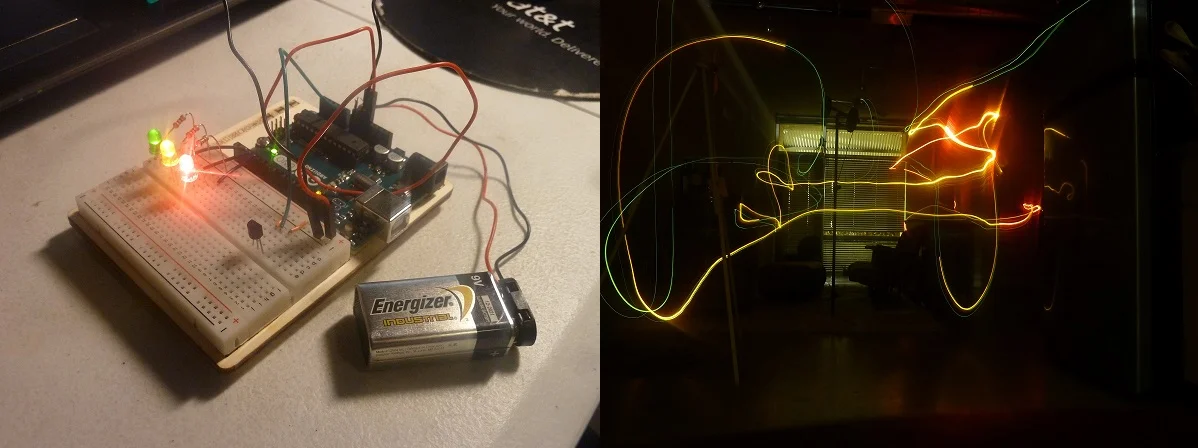
For the first experiment in mapping, I paired temperature as my metric with time-lapse photography as my positioning device. I have an Arduino board with a temperature sensor that illuminates one to three LEDs based on the air temperature in that location. By attaching a 9v battery as a mobile power source, I can then set up a long exposure photo and carry the Arduino around the room for 30 seconds. The warmest places in the room activate the red LED, and the coolest places in the room activate the green. Success! Now on to a more ambitious pairing.

Next, I want to measure temperature and daylight with GPS as my positioning system. Unlike the LED long exposure photography, I will actually have to record the data I collect and sync it to a time stamp and GPS coordinates.

This is how the Arduino is set up. I have a battery pack for mobile power (6 AA batteries are more efficient than a 9v), a TMP36 temperature sensor, and a photocell for detecting light. I need a real-time clock for recording the time, and I need a way to store all of this data. I'm using an Adafruit data logger shield to keep time and record it to an SD card.

The data logger shield requires some header pins to be soldered onto it so it can be inserted on top of the Arduino. I edited some example Arduino programs so that it would record light, temperature, and a time stamp once a second, and uploaded the program to the Arduino. Once the code is uploaded, it stays on the Arduino and immediately begins working when the battery pack is plugged in. There are GPS shields for Arduino that would allow me to record location as well, but for now, I'm using a GPS app on my phone with a time stamp, and running the two simultaneously. Now it's ready for data collection!

The setup is a little conspicuous, so I found it to be more discrete and efficient to set it up on the front of my car or bike, with a paper shield to hide all the fun bits, leaving only the temperature and light sensors exposed. Then I go for a joyride through whatever space I want to map.
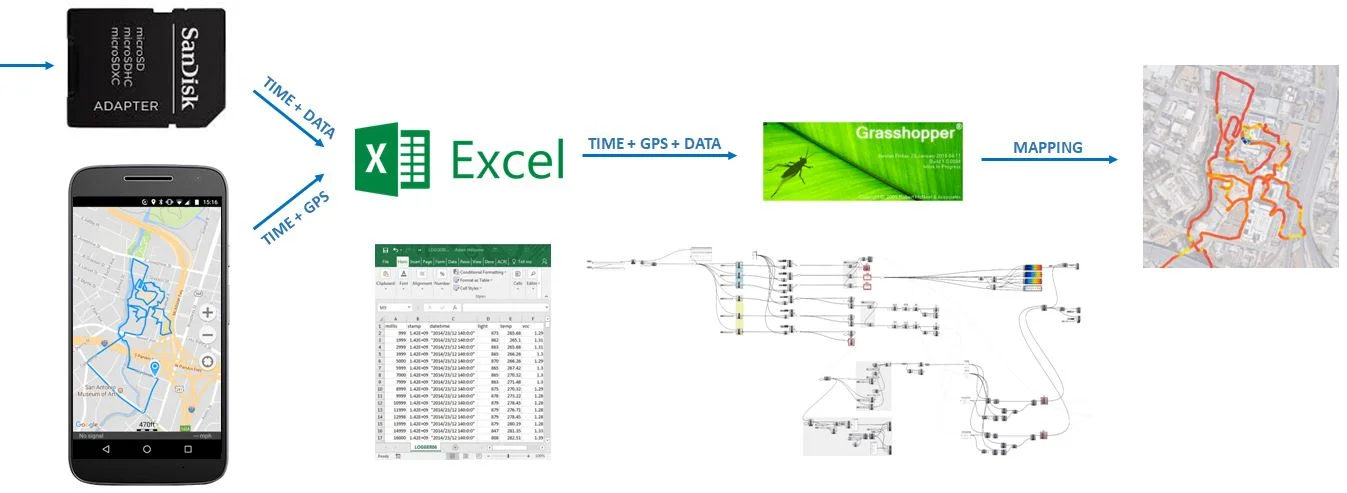
Now for the second half of the workflow. This part came a lot more naturally to me, because I spend much more of my time with Excel and Grasshopper than I do with Arduino. I upload the GPS path from my phone to the computer, and upload the data from the SD card. Both of these come in the form of a .CSV, which I combine into one file.
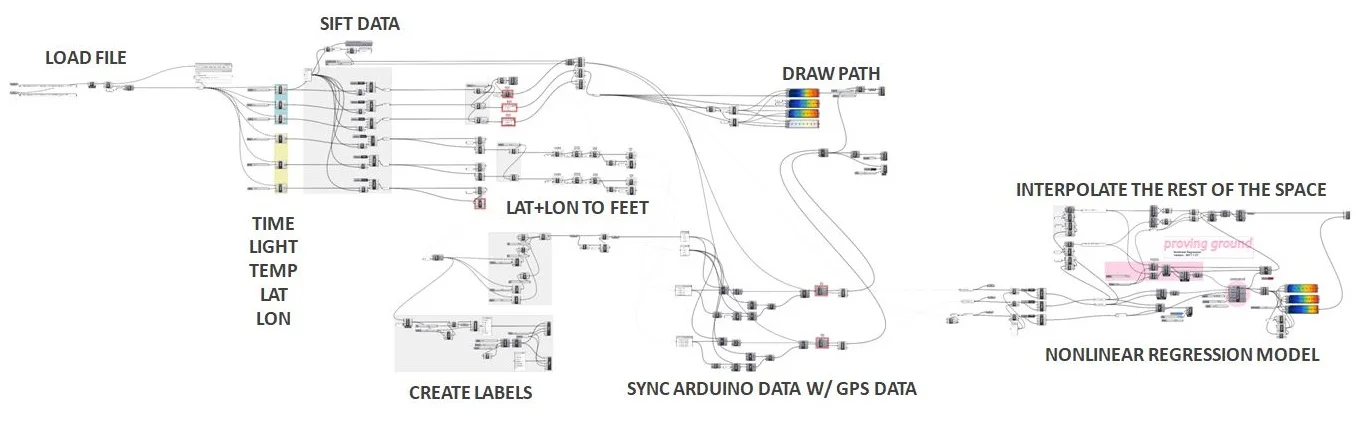
I read the .CSV file through Grasshopper, and break out each data point: Time, Light, Temperature, Latitude, and Longitude. This particular joyride was 30 minutes, or about 1,800 seconds, which means 1,800 data points. If this becomes too dense for some operations down the line, I add a sift pattern to only take every other data point, or every third data point, and so on. I'm also choosing the domain of each, because my phone GPS and Arduino don't start at exactly the same time, and I'll need to calibrate it slightly to sync. I'm converting degrees latitude and longitude to feet, because working with true degrees is awful in Rhino. A big issue I had with this setup is that the GPS app on my phone didn't always record a data point every second. It was more like two out of every three second. So I had to interpolate that data and re-plot it to get a single data point every second. Finally, I'm plotting the location with a value to get paths like this:
Light in the Pearl District, San Antonio
Temperature in the Pearl District, San Antonio
Once I have all of this mapped, I'm using Proving Ground's Non-Linear Regression component, a fun new tool from LunchBoxML. Nonlinear regression takes several three-dimensional points (X=longitude, Y=latitude, Z=light or temperature) and interpolates the rest of the surface.

Nonlinear regression to interpolate the temperature of the rest of the space, as the domain expands.
Nonlinear regression worked very well for this, it just just takes some fiddling with the sigma value to get meaningful results. A low sigma value (left) is very local and does not smooth itself out or interpolate very far from a real data point. A high value (right) smooths things out a little too much for this scale.

By overlaying the light and temperature maps onto a plan, I get a somewhat accurate map.

Temperature at the Pearl

Daylight at the Pearl
I consider this a good proof of concept, and now I'll have to think carefully about what tests would be most meaningful to do next. These maps don't yet tell me anything surprising: It appears to be darker under bridges and behind tall buildings. This is about the scalar limit of GPS. Being in or near a building seems to interfere with its accuracy, so if I want to actually map interior spaces with more precision, I will need to explore other positioning options besides GPS.
The more passes I take in a location, the more accurate the results will be. This is not a bad amount of data for a half hour bike ride in a space this big, but it would be interesting to get more accurate and nuanced results in a smaller space.
Next steps are too think about what other metrics to measure (perhaps incorporate some biometrics?) and to consider alternative positioning systems.